
Introduction
Health information avoidance—defined as any behavior designed to prevent or delay access to available but potentially unwanted health information (Howell et al. (2020); Sweeny et al. (2010))—remains a significant barrier to realizing the public health benefits of personalized risk communication. Despite the rapid expansion of access to medical information in the Information Age, many people still choose not to learn about their personal health risks (Gigerenzer & Garcia-Retamero (2017); Ho et al. (2021); Kelly & Sharot (2021)). Health information avoidance is not a uniform behavior, but can take multiple forms, varying in its duration and degree of intentionality. Individuals may avoid health information by delaying the decision to learn about their screening results or they may avoid it completely, choosing to never know. Information avoidance may also manifest through both active and passive means. People may explicitly ask others not to disclose information, physically remove themselves from situations were information might be revealed, or passively refrain from questions that could reveal unwanted knowledge. These avoidance behaviors may manifest as refusing cancer screening, delaying medical care, or not requesting test results (Sweeny et al. (2010)).
Research indicates that health information avoidance is common. For example, approximately 15% of US adults avoid personalized health risk information across various contexts (Meese et al., 2022), and nearly 39% express a reluctance to learn about their cancer risk (Emanuel et al. (2015)). Similar avoidance rates (e.g., approximately 40%) have been observed for non-personalized health information (i.e., general health information not relevant to personal risk) (Chae et al. (2019); Orom et al. (2020)).
Such widespread avoidance underscores the need to understand how and why individuals avoid health information. Some individuals may avoid health information to protect themselves from unpleasant emotions, prevent exposure to information that conflicts with their worldview or creates an obligation to act. Even when the information may be critical to health,avoidance eliminates the discomfort of decision-making and the emotional burden of confronting potential illness (Sweeny et al. (2010)). Previous research has identified various psychological and cognitive factors underlying this avoidance phenomenon and explored potential explanations for this behavior. O’Brien et al. (2024) found that self-perceptions of health, such as low perceived risk, engagement in healthy behaviors, and demographic characteristics, often guide people’s decisions to avoid learning about their health risks. Other studies have shown that information overload can increase anxiety and cognitive dissonance, leading to avoidance behavior (Dattilo et al. (2022); Song et al. (2021); Soroya & Faiola (2023)). Furthermore, heightened risk perceptions can exacerbate anxiety and sadness, which may further hinder people from seeking health information (Sultana et al. (2023); Zhao & Cai (2009)).
However, few studies have attempted to use machine learning methods to identify predictors of health information avoidance. This study applies predictive modeling and machine learning methods to examine patterns of cancer screening avoidance (“health avoiders”) using sociodemographic and psychological data. By integrating behavioral and belief factors, this study aimed to better understand the complex dynamics that lead to health information avoidance. The key finding is that while many predictors showed statistical significance, none provided meaningful predictive power. This suggests that the key determinants leading people to avoid health information remain unidentified.
Review of Machine Learning Methods
Machine learning (ML) methods were applied to identify patterns associated with health information avoidance. This study focuses on three main models: Logistic Regression, Random Forest, and Multivariate Adaptive Regression Splines (MARS). Each approach offers different advantages and trade-offs, summarized in Table 1 below.
Table 1. Comparison of Machine Learning Models
| Model | Description | Advantages | Limitations | Interpretability |
|---|---|---|---|---|
| Linear Regression | Models the relationship between predictors and a continuous outcome using a straight-line equation. | Simple, interpretable, and efficient to train; effective for linearly related data; allows understanding of variable relationships. | Assumes linearity and independence among variables; sensitive to outliers; limited for complex or nonlinear data. | High |
| Logistic Regression | Estimates the probability of a binary outcome based on a linear combination of predictors. | Simple, interpretable, good baseline; easy to assess predictor importance. | Assumes linearity; struggles with nonlinear or high-dimensional data. | High |
| Random Forest | Ensemble of decision trees using bootstrapped samples and random feature selection. | Handles nonlinear and complex data; reduces overfitting; provides feature importance. | Less interpretable; slower with large datasets; harder to explain model logic. | Moderate |
| MARS (Multivariate Adaptive Regression Splines) | Builds flexible regression models using piecewise linear splines. | Captures nonlinear relationships; performs automatic feature selection; minimal preprocessing needed. | Computationally intensive; interpretation can be challenging with correlated predictors. | Moderate - High |
Linear / Logistic Regression served as a baseline interpretable model, Random Forest captured complex nonlinear interactions, and MARS modeled adaptive spline-based relationships between predictors and cancer avoidance. By comparing these models, this study aimed to identify the most effective approach to predict health information avoidance while maintaining interpretability.
Method
Data Source
This study used the de-identified Health Avoiders dataset provided through Cloud Research in collaboration with Dr. Heather Orom (University at Buffalo). The dataset includes sociodemographic, psychological, and behavioral variables collected by Cloud Research. All analyses were conducted in R, and reproducibility was ensured through a README file and a Quarto documentation workflow.
Outcome Variable
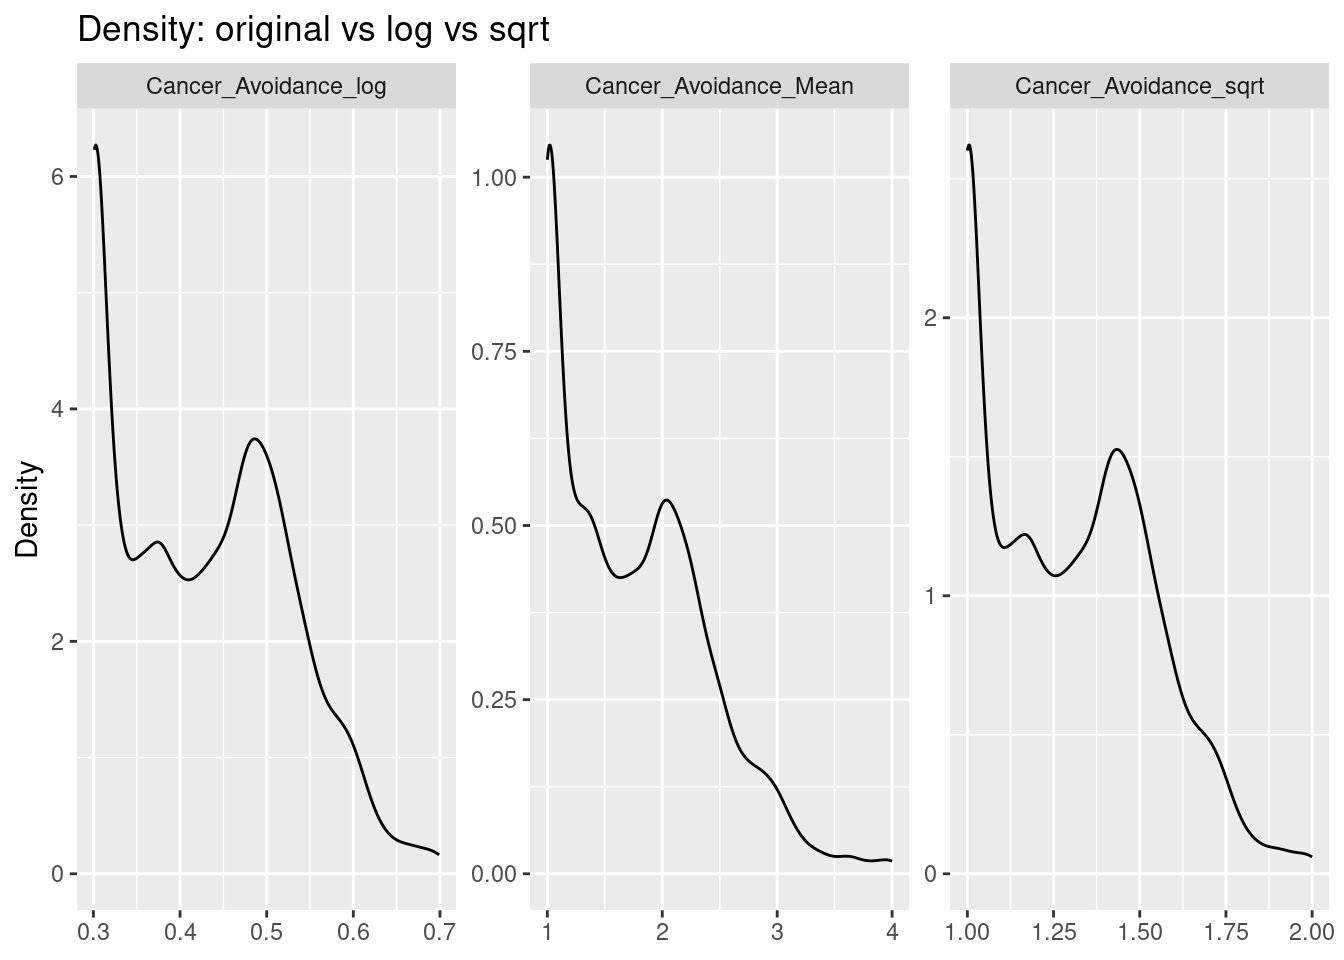
The outcome variable, Cancer_Avoidance_Mean, represents the average score across 8 items (Avoid_Cancer_)measuring participants’ avoidance of cancer-related health information. Because this variable exhibited non-normality, both logarithmic and square-root transformations were tested; however, these transformations did not improve model performance or interpretability, so the untransformed variable was retained for analysis.
Predictor Models
Heather Orom (University at Buffalo) developed a theoretical framework to group predictors as a health psychologist studying health information avoidance.
Demographic Model (
demo_data) —Ethnicity,Political_Party,Gender4,Job_Classification,Education_Level,Age,Income,Race, andMacArthur_Numeric.Media Use Model (
media_data) —Social_Media_Usage,AI_Use,Video_Games_Hours,Listening_Podcasts,Facebook_Usage_cat,TikTok_Use,X_Twitter_Usage,Social_Media_type, andInfluencer_Following.Health Condition Model (
health_condition_data) —Stressful_Events_Recent,Current_Depression,Anxiety_Severity_num,PTSD5_Score,Health_Depression_Severity_num, andStress_TotalScore.Health Behavior Model (
health_behavior_data) —Fast_Food_Consumption,Meditation_group,Physical_Activity_Guidelines,Cigarette_Smoking_num,Supplement_Consumption_Reason_num,Diet_Type, andSupplement_Consumption.Other Factors Model (
other_data) —Home_Ownership,Voter_Registration,Climate_Change_Belief, andMental_Health_of_Partner.
Variable Scaling and Scoring
Several psychological and health condition variables were standardized using validated scales:
PC-PTSD-5: a 5-item yes/no screen for post-traumatic stress.
GAD-7: a 7-item measure of anxiety severity (0–3 scale).
PHQ-9: a 9-item measure of depression severity (0–3 scale).
Life Events Checklist: summed to represent cumulative stress exposure.
Composite averages were computed for each domain, resulting in 4 continuous variables: PTSD5_Score, Anxiety_Severity_num, Health_Depression_Severity_num, and Stress_TotalScore.
Analysis Plan
Predictive modeling was conducted in R using the tidymodels package. Due to the non-normal outcome variable, two complimentary approaches were applied:
Regression Models: predicted the continuous outcome
Cancer_Avoidance_Meanwere fitted using Linear Regression (baseline), Random Forest, and Multivariate Adaptive Regression Splines (MARS). Model performance was assessed using root mean squared error (RMSE), mean absolute error (MAE), and the correlation between predicted and observed values.Classification Models: predicted the binary outcome
Cancer_Avoiders01(0 = non-avoider, 1 = avoider) were fitted using Logistic Regression (baseline) and Random Forest. Model performance was assessed using area under the curve (AUC) and accuracy with basic calibration applied when class imbalance occurred.
Some models used cross-validation, and Linear / Logistic Regression served as the baseline for comparison.
Results
All analyses were conducted in Posit Cloud, a collaborative online platform for writing R scripts and developing Quarto markdown documents.
Overview of Model Performance
Table 2 summarizes the predictive performance across all modeling approaches. Consistent with the study’s central finding, all models demonstrated statistically significant associations but no meaningful predictive power.
Table 2. Summary of Model Performance Across All Approaches
| Domain | Model Type | Key Metric | Value | Interpretation |
|---|---|---|---|---|
| Demographics | Regression (RF) | Correlation | 0.107 | No predictive relationship |
| Demographics | Regression (MARS) | Cross-val R² | 0.013 | Poor generalization |
| Demographics | Classification (RF) | ROC AUC | 0.424 | Below chance performance |
| Media Usage | Regression (RF) | Correlation | 0.059 | No predictive relationship |
| Media Usage | Classification (RF) | ROC AUC | 0.495 | Below chance performance |
| Health Condition | Regression (RF) | Correlation | 0.093 | No predictive relationship |
| Health Condition | Regression (MARS) | Cross-val R² | 0.007 | Poor generalization |
| Health Condition | Classification (RF) | ROC AUC | 0.478 | Below chance performance |
| Health Behavior | Regression (RF) | Correlation | 0.053 | No predictive relationship |
| Health Behavior | Classification (RF) | ROC AUC | 0.484 | Below chance performance |
| Other Factors | Regression (RF) | Correlation | 0.155 | Weak relationship |
| Other Factors | Classification (RF) | ROC AUC | 0.474 | Below chance performance |
| Full Model | Regression (RF) | Correlation | 0.293 | Weak relationship |
| Full Model | Classification (RF) | ROC AUC | 0.228 | Worse than individual models |
Note: RF = Random Forest; MARS = Multivariate Adaptive Regression Splines. Classification models showed high accuracy (94-96%) due to class imbalance but uniformly poor discrimination (AUC < 0.60). All R² values were < 0.03.
The following sections detail findings for each predictor domain, focusing on the strongest associations identified despite their limited predictive utility.
Overview of Findings
This analysis examined five predictor domains: demographic, health status, health behaviors, media usage, and other attitudinal variables. In all modeling approaches, predictors were statistically significant with cancer avoidance behavior, but their predictive power was limited. The following paragraphs detail the findings for each domain.
Demographic Predictors
Linear regression analysis showed a significant negative association between socioeconomic status (MacArthur numerical score) and cancer avoidance behavior (β = -0.025, p = 1.89e-10), but the model explained only 0.5% of the variance (R² = 0.005). Age analysis identified a threshold of 35 years, with older individuals exhibiting significantly higher cancer avoidance scores (β = 0.063, p = 1e-05).
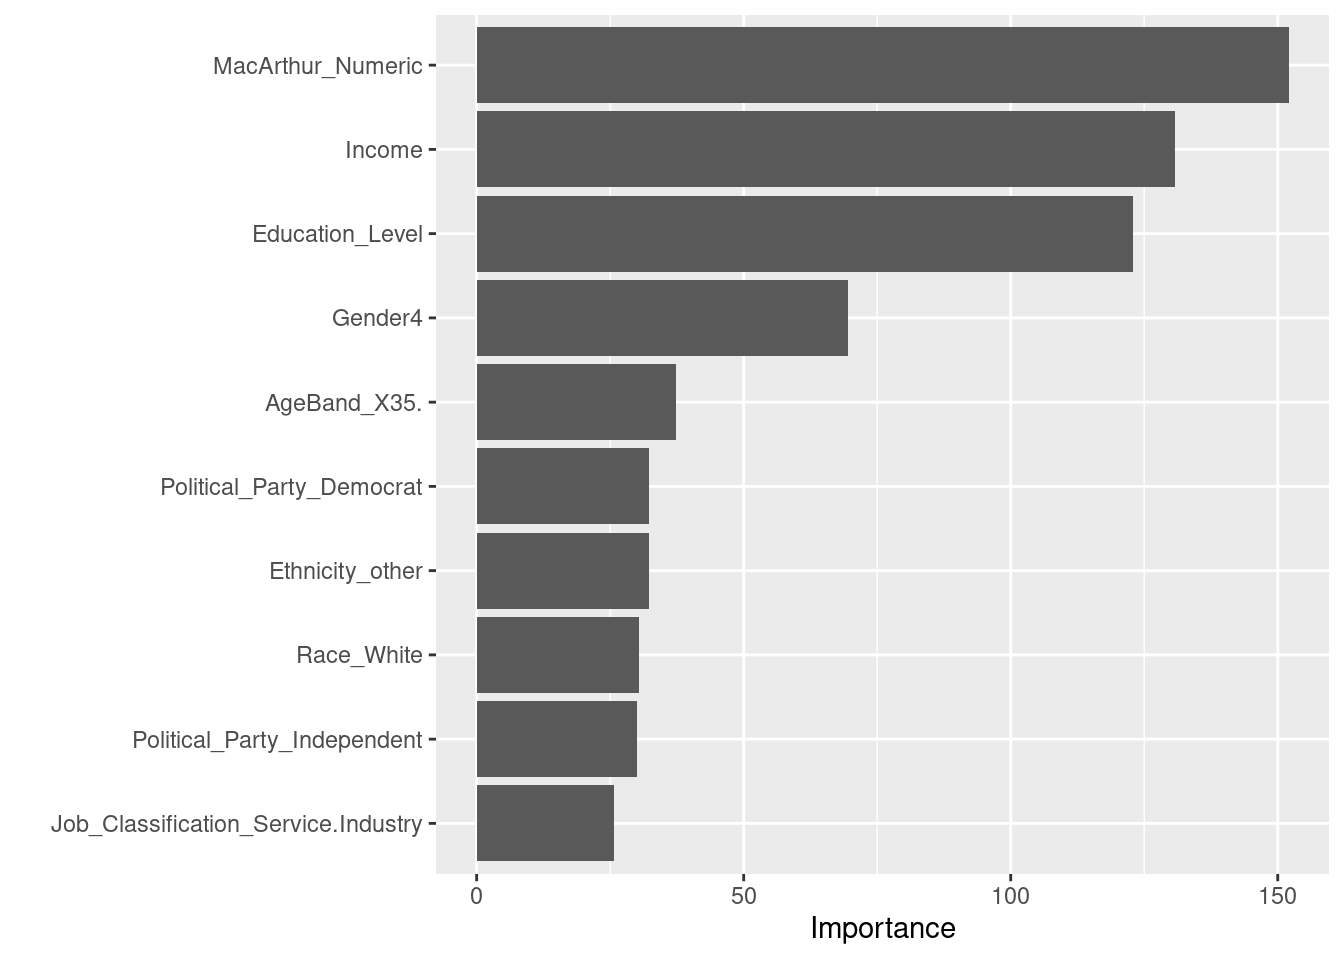
In both age groups (under 35 and over 35), Democrats had lower cancer avoidance scores than Republicans: under 35 (β = -0.165, p = 8.97e-08) and over 35 (β = -0.225, p = 2.67e-15). MARS analysis confirmed that party affiliation was the most important factor (importance = 100). Although the classification model showed high accuracy (95.5%), its discrimination was poor (ROC AUC = 0.449), indicating statistically significant but not practically predictive effects.
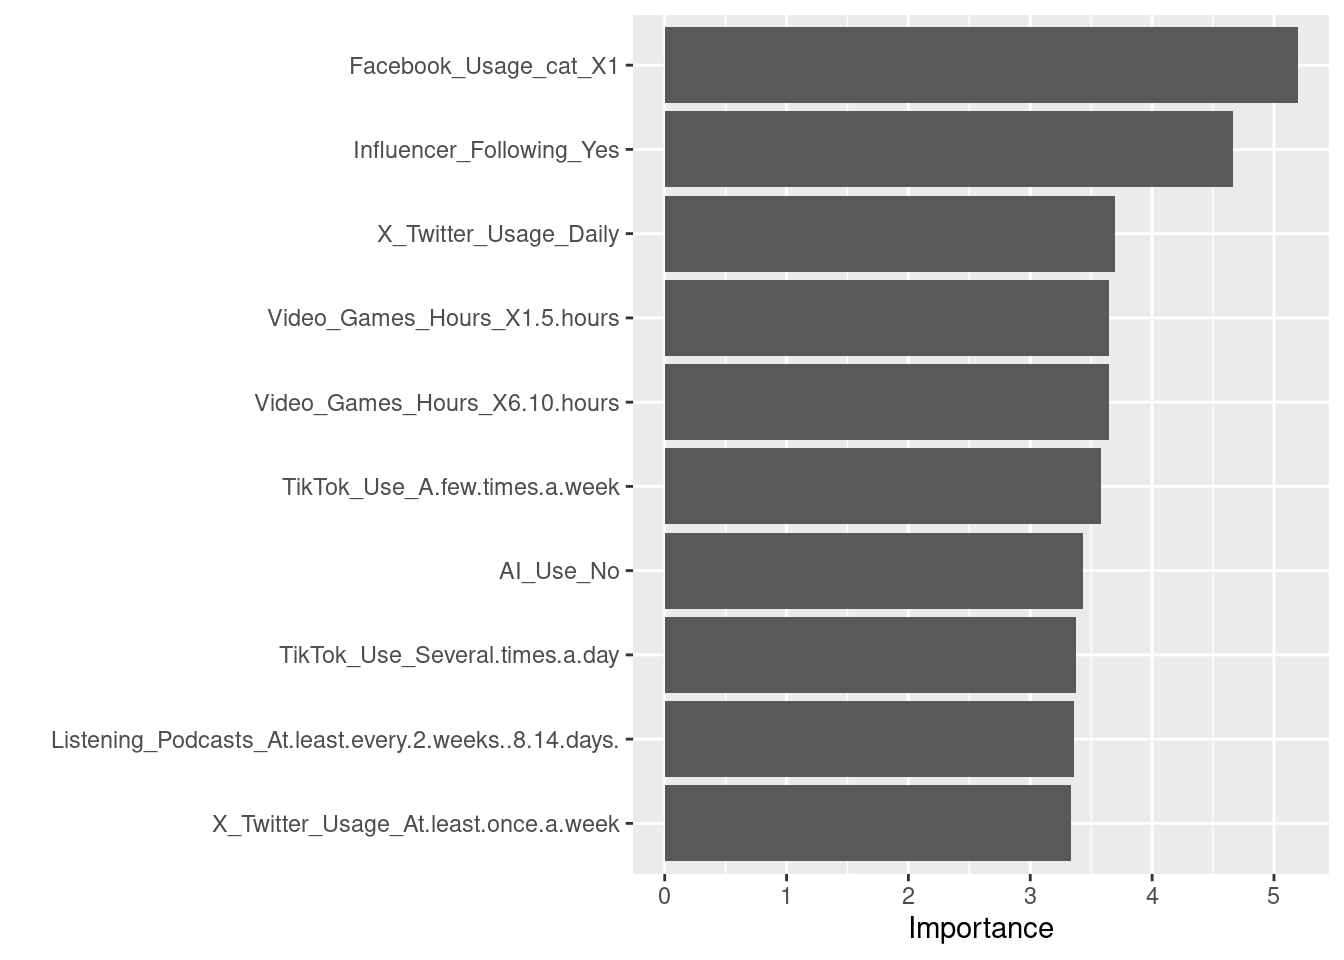
Media Usage Predictors
Media usage variables showed minimal predictive value (overall correlation = 0.059). Influencer following was not significantly associated with cancer avoidance (β = -0.012, p = 0.601, R² = 0.00008). AI usage showed a none statistically significant (β = -0.255, p = 0.103), with nearly equal proportions of cancer avoiders among users (5%) and non-users (4%). These effects are not practically meaningful.
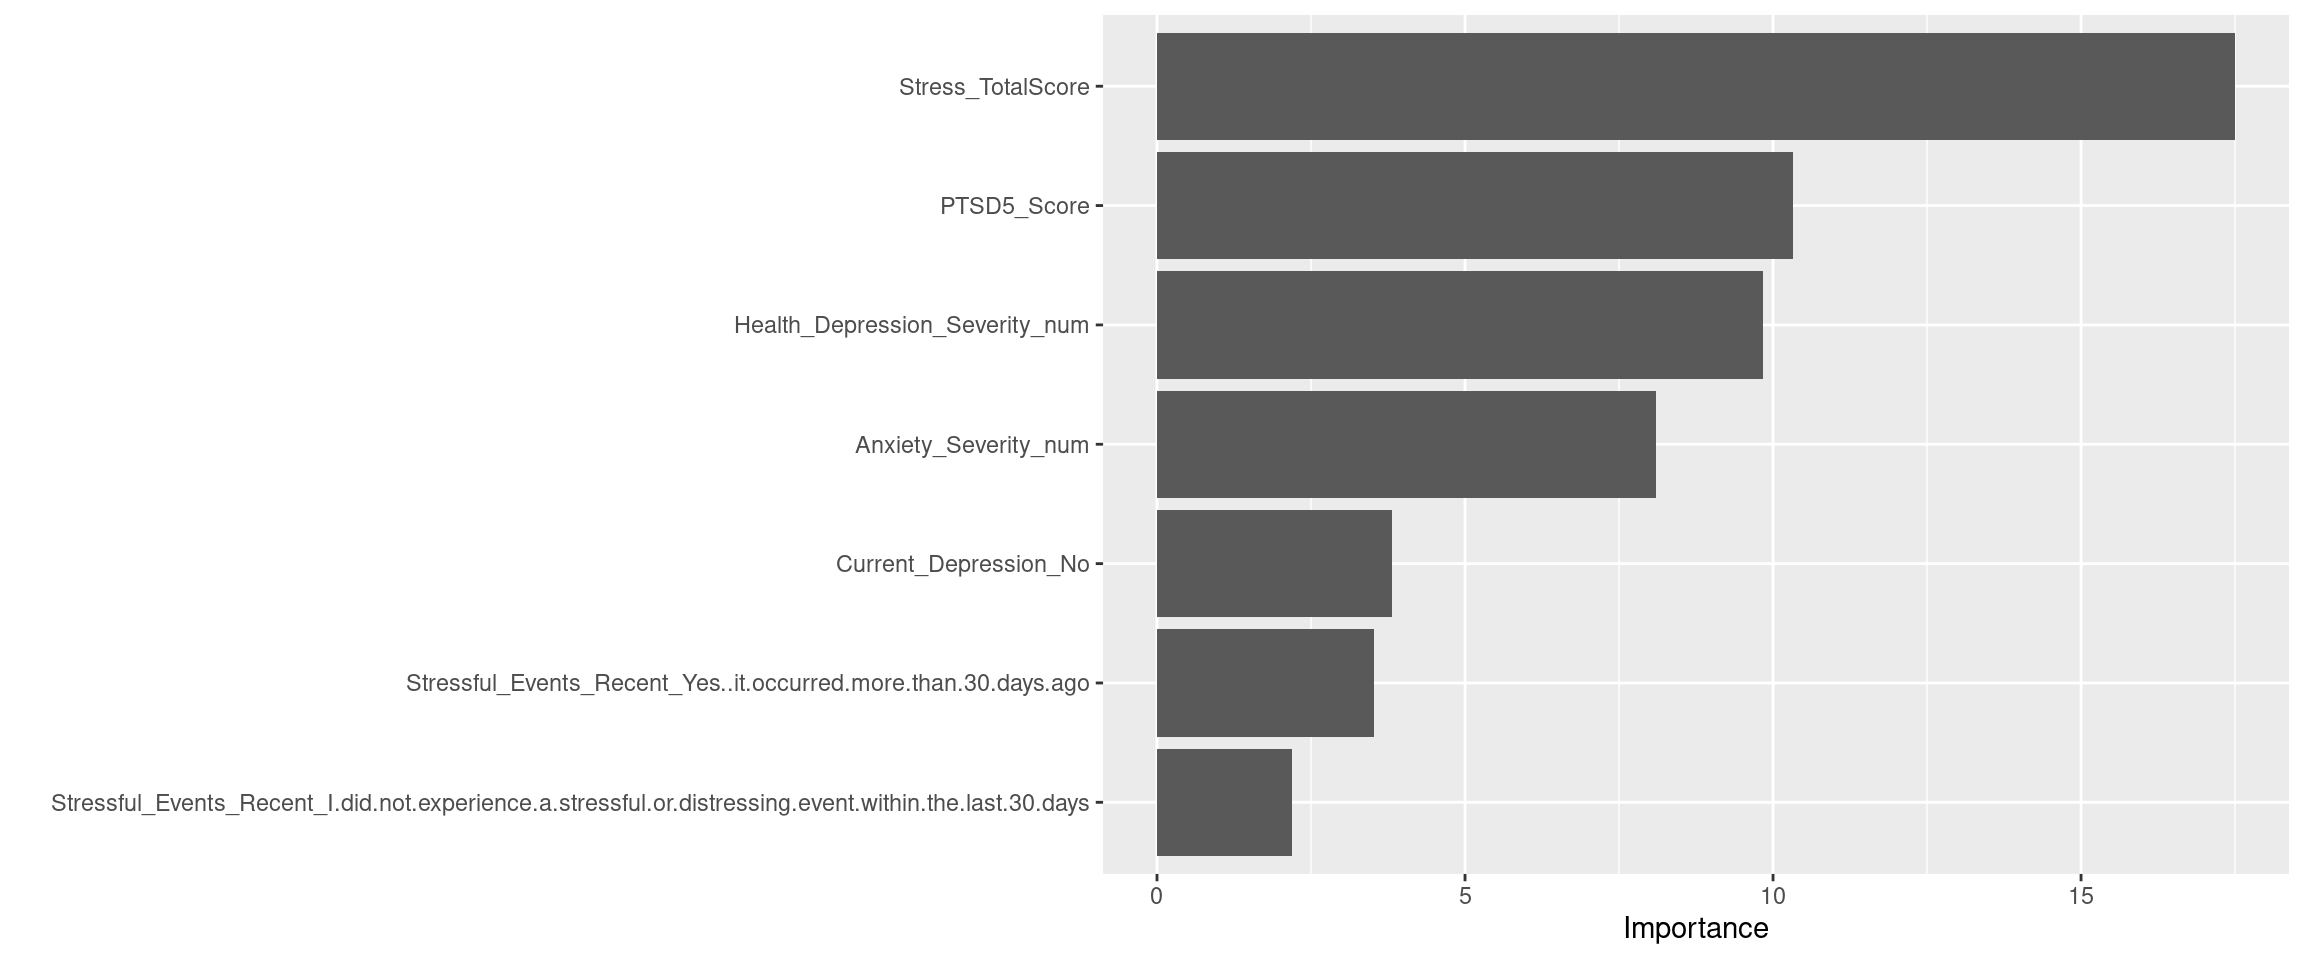
Health Condition Predictors
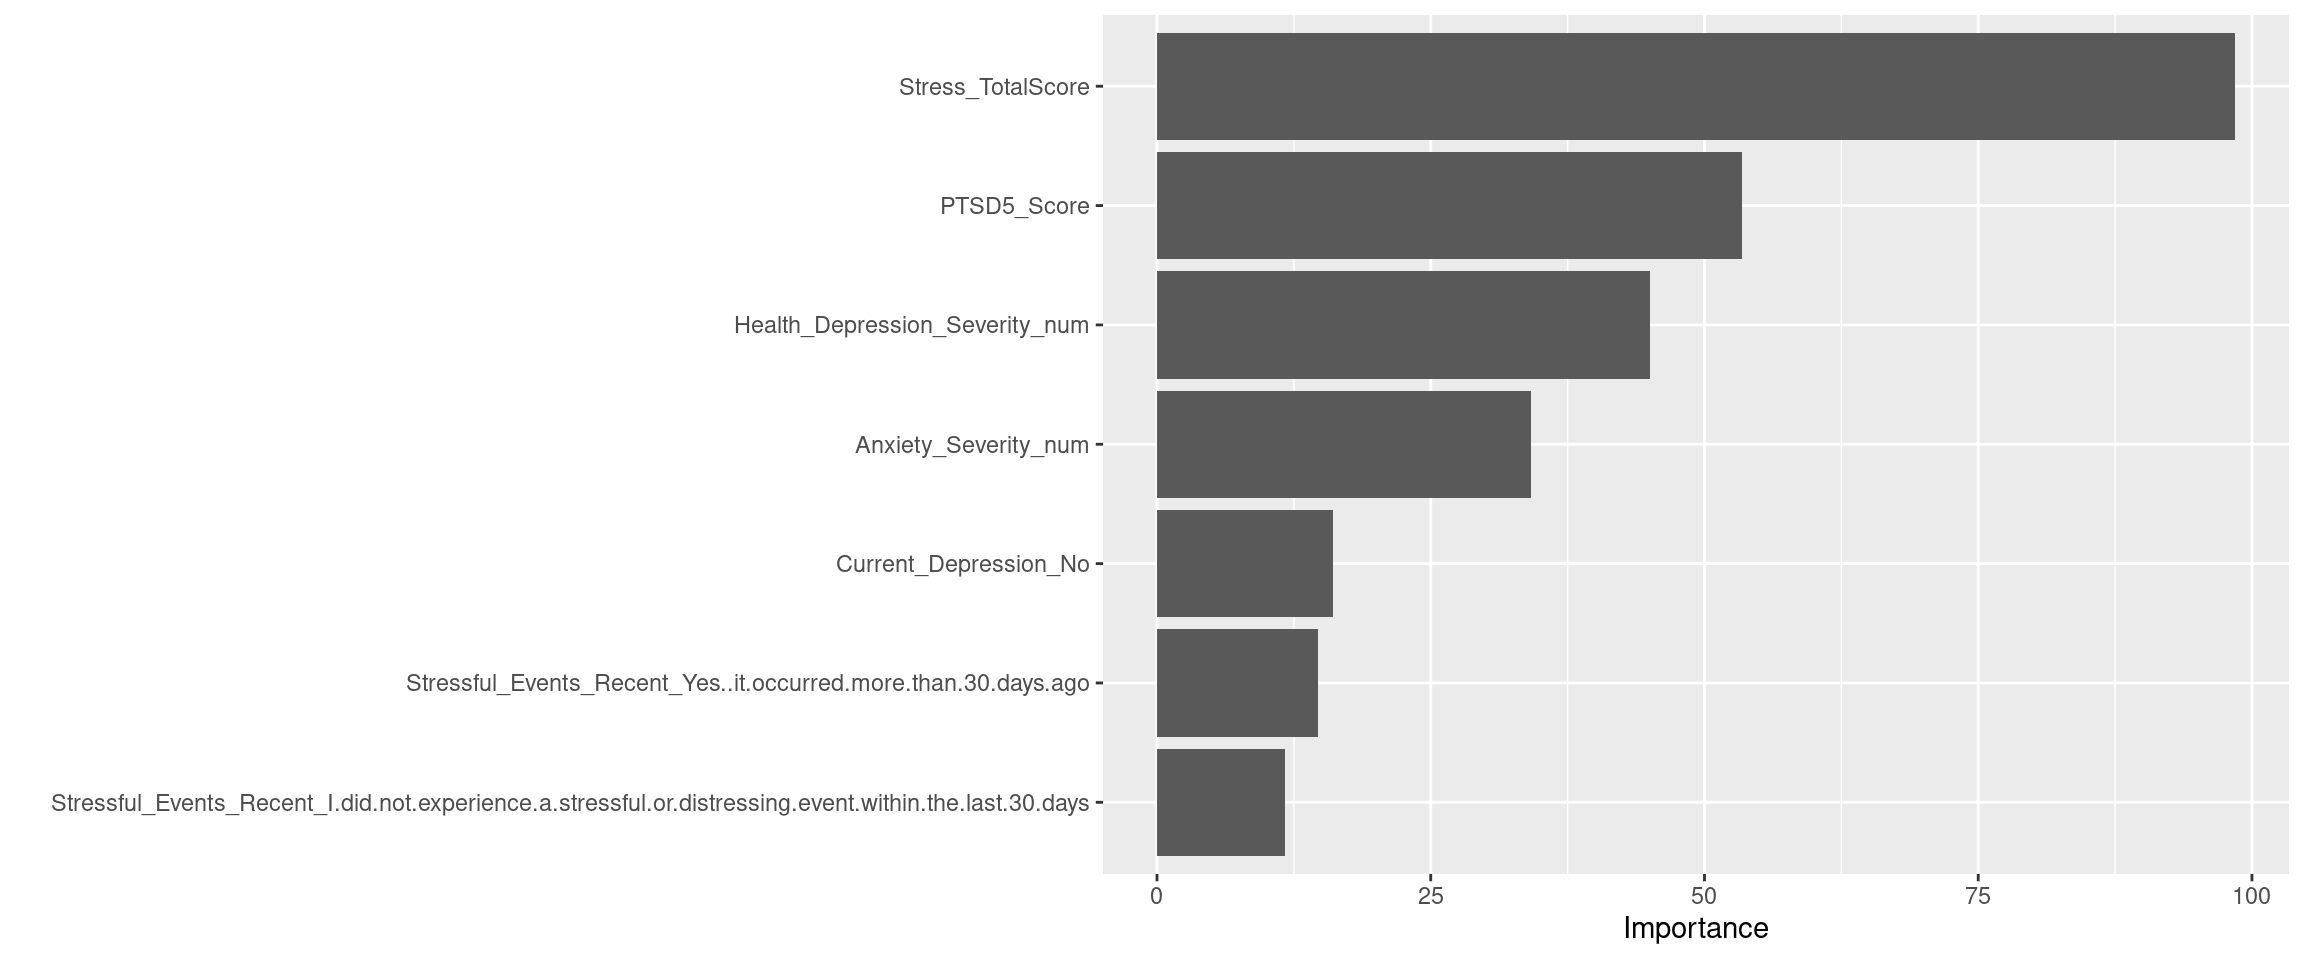
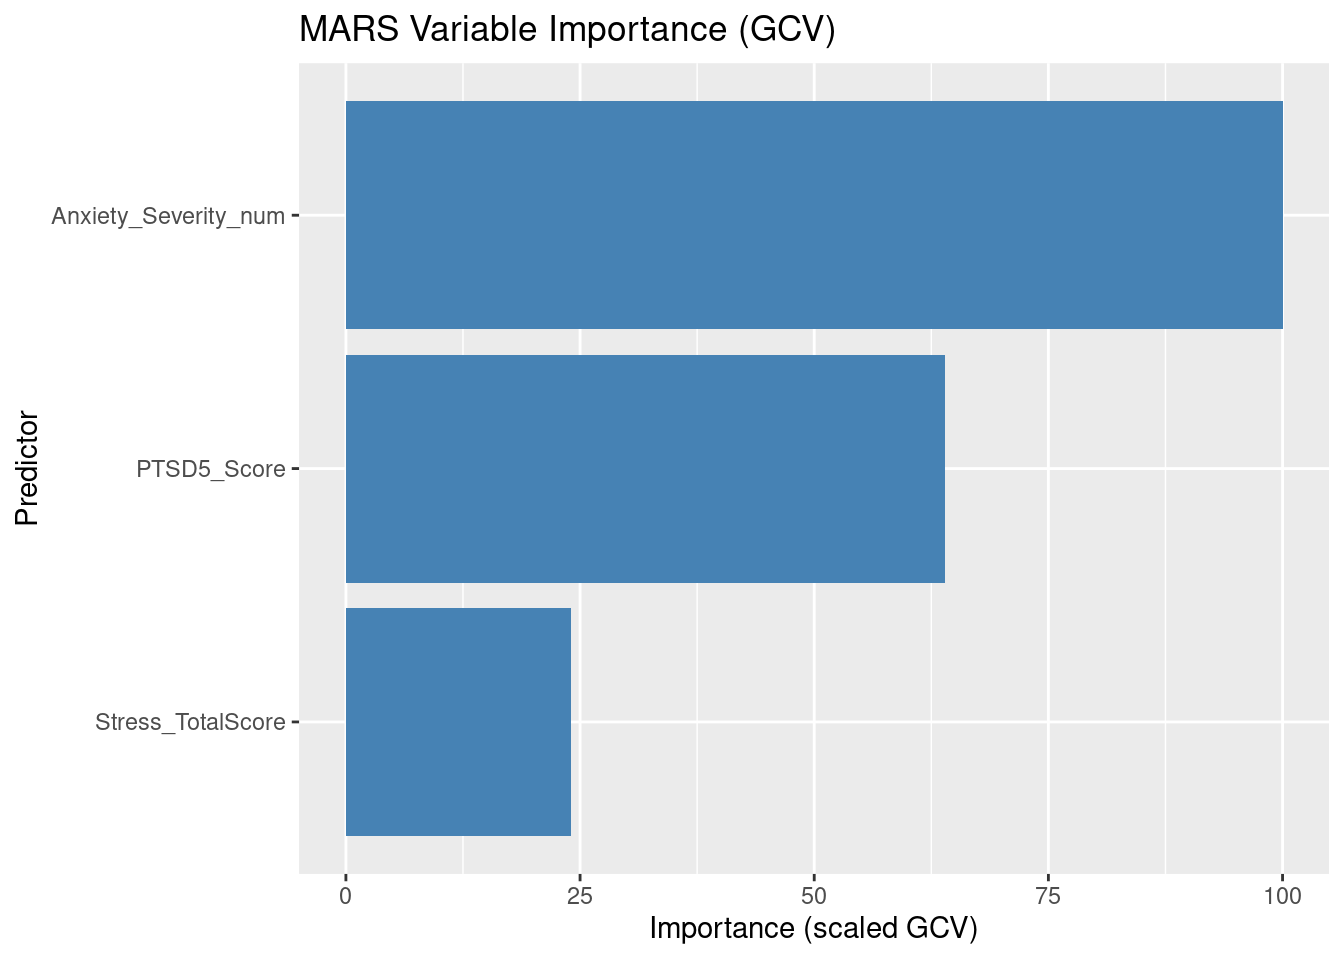
Predictive relationships among health condition variables were weak. The total stress score showed no significant trend (β = 0.005, p = 0.056, R² = 0.0005). While the MARS model identified anxiety severity as the most important factor, cross-validation performance was negative (CVRSq = 0.007), suggesting no generalizable pattern. The classification model also failed to meaningfully differentiate cancer avoiders.
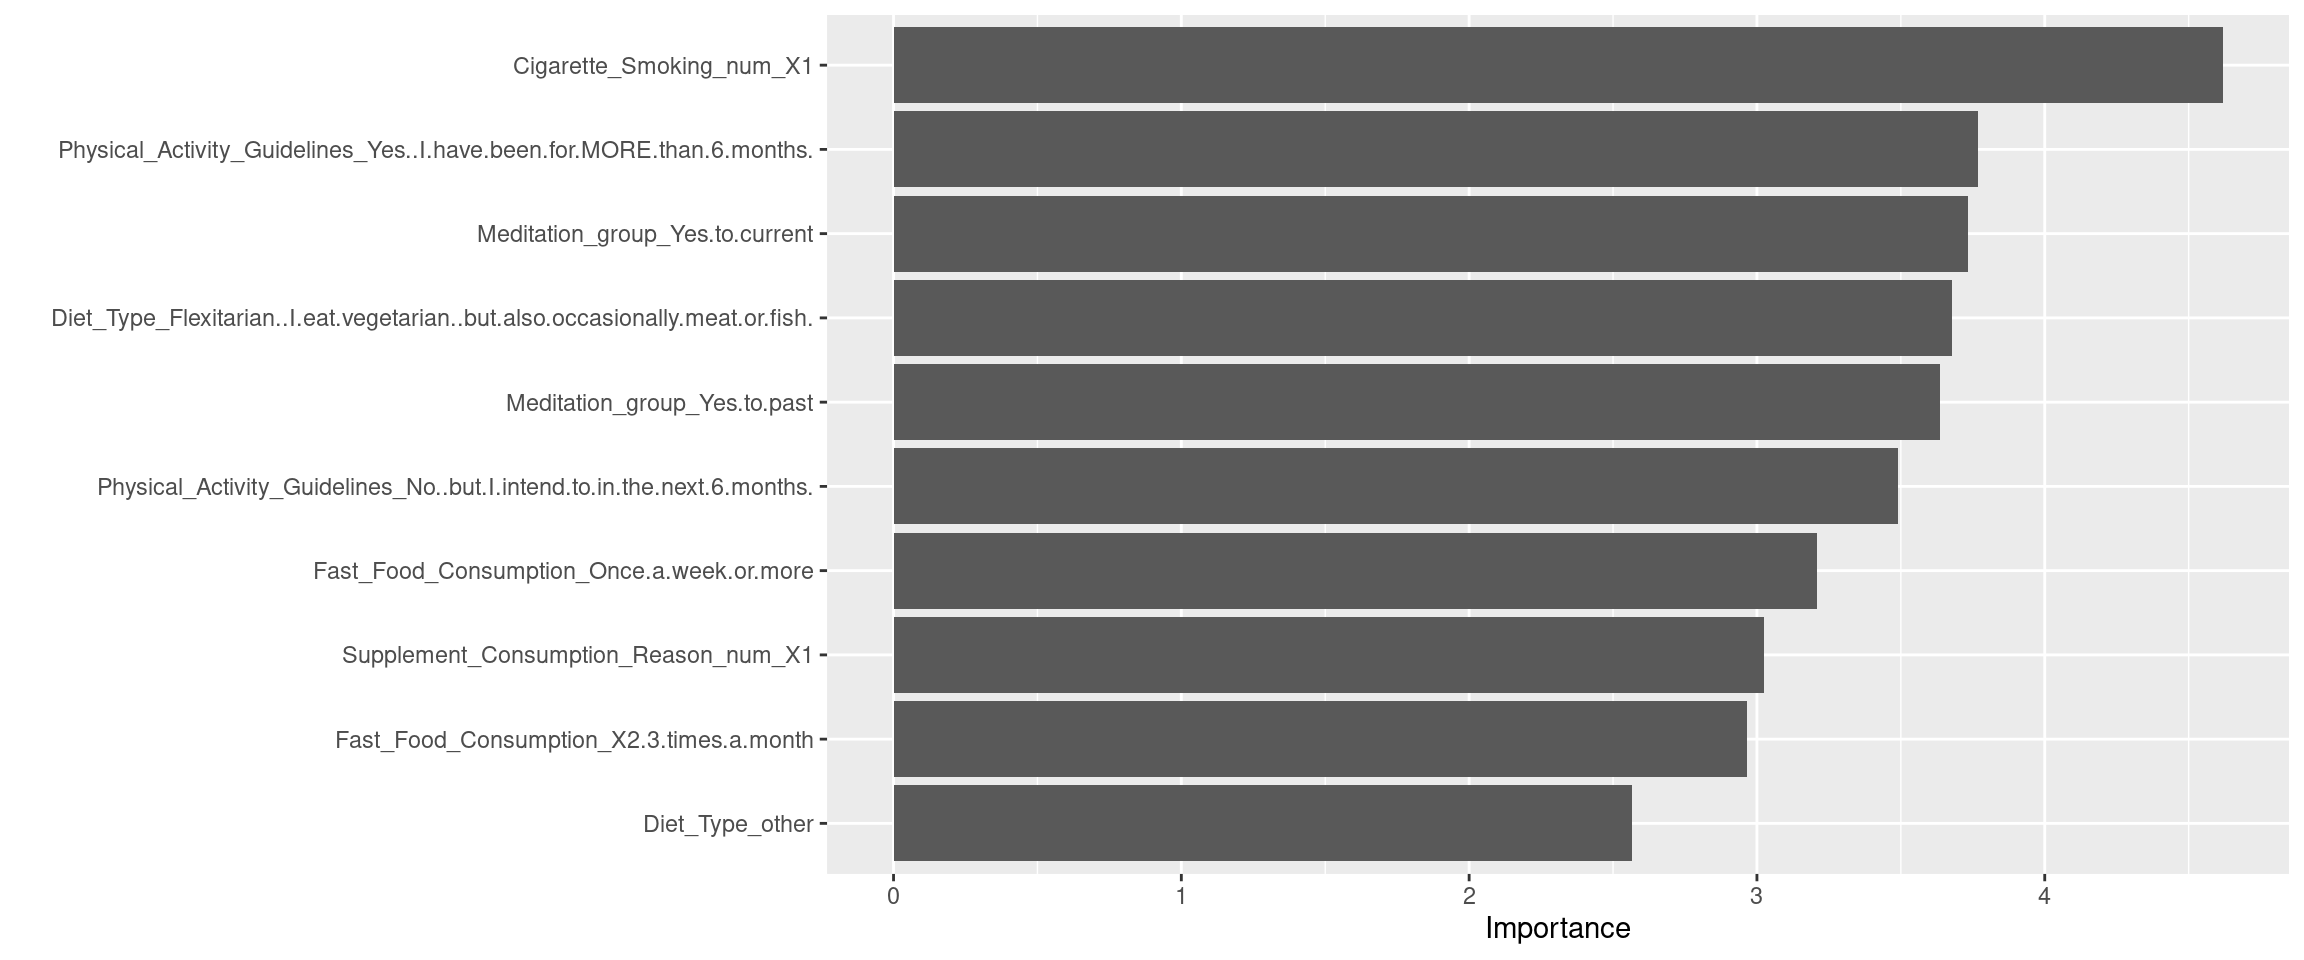
Health Behavior Predictors
Cigarette smoking demonstrated a significant positive relationship with cancer avoidance. Smokers had higher cancer avoidance scores (β = 0.185, p < 2e-16, R² = 0.011) and 1.87 times higher odds of being cancer avoiders (β = 0.624, p = 1.14e-06). Approximately 8–9% of smokers were cancer avoiders compared to 4–5% of non-smokers. Despite statistical significance, the overall predictive power remained limited.
Other Predictors: Climate Change Beliefs
Climate change beliefs were statistically associated with cancer avoidance (R² = 0.024). Individuals who strongly believe in human-caused climate change had lower cancer avoidance scores (β = -0.270, p = 3.62e-13) and 0.29 times the odds of being cancer avoiders compared to climate deniers (β = -1.233, p = 1.99e-10). Climate deniers showed 12–13% cancer avoiders compared to 3–4% among strong believers. Despite statistical significance, model differentiation remained poor (ROC AUC = 0.474).
Comprehensive Model: Combining Major Predictors
Random forest models incorporating all main predictors showed modest improvement. The regression model achieved a correlation of 0.293 (RMSE = 0.62, MAE = 0.52). The classification model achieved 95% accuracy but failed to meaningfully differentiate cancer avoiders (ROC AUC = 0.23).
Across all analyses, predictors were statistically significant but not practically predictive (R² < 0.03, ROC AUC < 0.50), indicating that the measured variables have limited explanatory power for cancer avoidance behavior.
Data Preprocessing and Descriptive Statistics
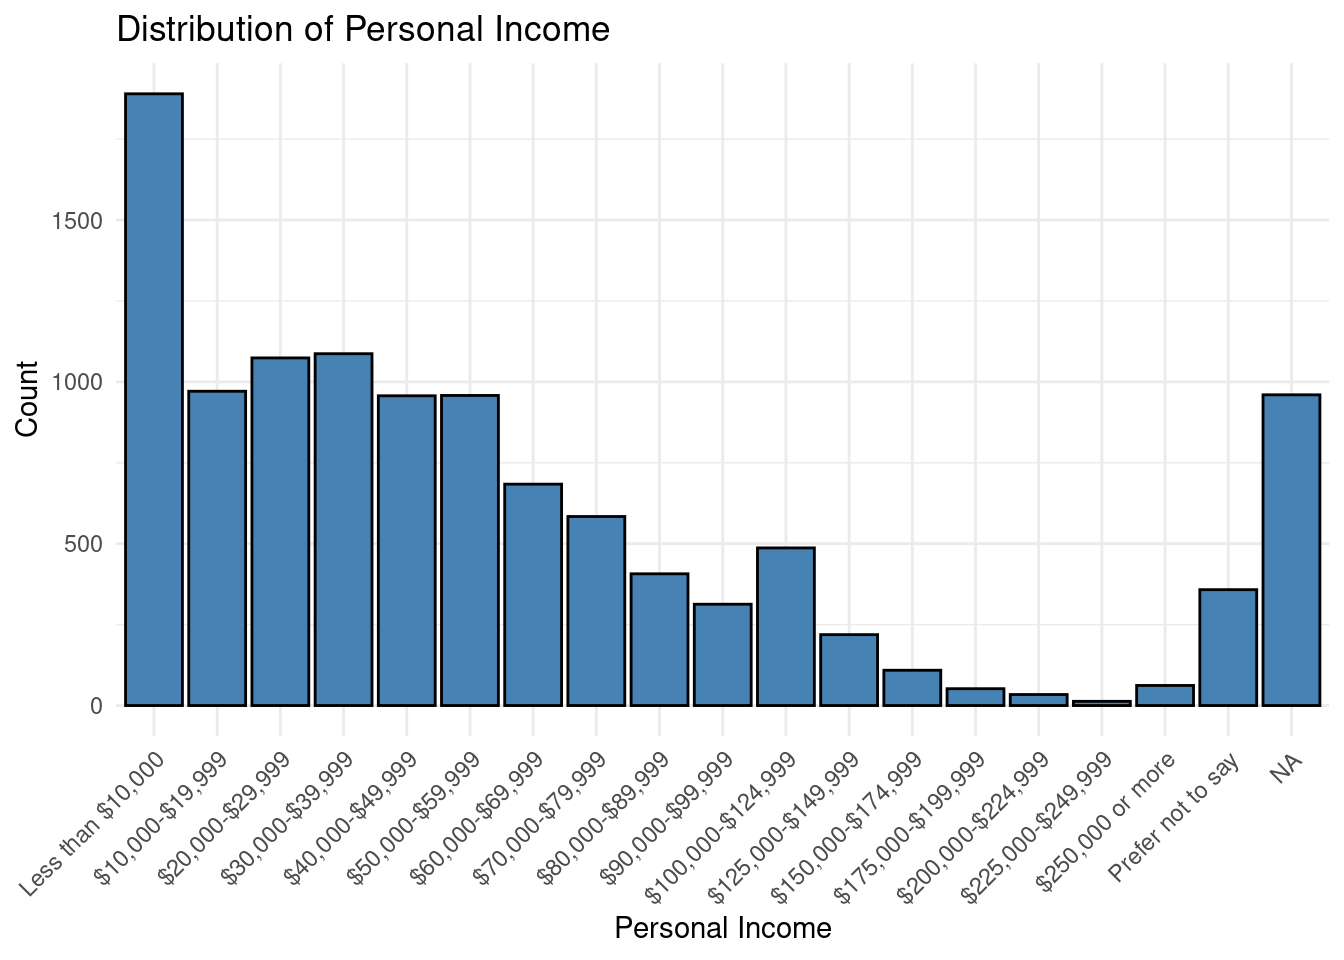
Predictor Distributions
Predictors
Outcome Distribution and Item Correlations
The outcome variable,
Cancer_Avoidance_Mean, was computed as the average of 8 items measuring participants’ avoidance of cancer-related health information. Four of these itemsAvoid_Cancer3,Avoid_Cancer5,Avoid_Cancer7,Avoid_Cancer8were reverse-coded to ensure higher scores consistently reflected greater avoidance. Reverse scoring was calculated using the formula:- Reversed score=(Max+Min)−Original score
Correlation
              Avoid_Cancer1 Avoid_Cancer2 Avoid_Cancer3 Avoid_Cancer4
Avoid_Cancer1     1.0000000     0.6630406     0.6183513     0.6070080
Avoid_Cancer2     0.6630406     1.0000000     0.6133007     0.5868175
Avoid_Cancer3     0.6183513     0.6133007     1.0000000     0.5548689
Avoid_Cancer4     0.6070080     0.5868175     0.5548689     1.0000000
Avoid_Cancer5     0.6327704     0.6199146     0.7434057     0.5385664
Avoid_Cancer6     0.6836967     0.5083451     0.4888538     0.5932237
Avoid_Cancer7     0.4872519     0.4905417     0.5814828     0.4147951
Avoid_Cancer8     0.5683390     0.5446767     0.7115745     0.5050838
              Avoid_Cancer5 Avoid_Cancer6 Avoid_Cancer7 Avoid_Cancer8
Avoid_Cancer1     0.6327704     0.6836967     0.4872519     0.5683390
Avoid_Cancer2     0.6199146     0.5083451     0.4905417     0.5446767
Avoid_Cancer3     0.7434057     0.4888538     0.5814828     0.7115745
Avoid_Cancer4     0.5385664     0.5932237     0.4147951     0.5050838
Avoid_Cancer5     1.0000000     0.4905928     0.5564896     0.7388451
Avoid_Cancer6     0.4905928     1.0000000     0.3516301     0.4460555
Avoid_Cancer7     0.5564896     0.3516301     1.0000000     0.5176124
Avoid_Cancer8     0.7388451     0.4460555     0.5176124     1.0000000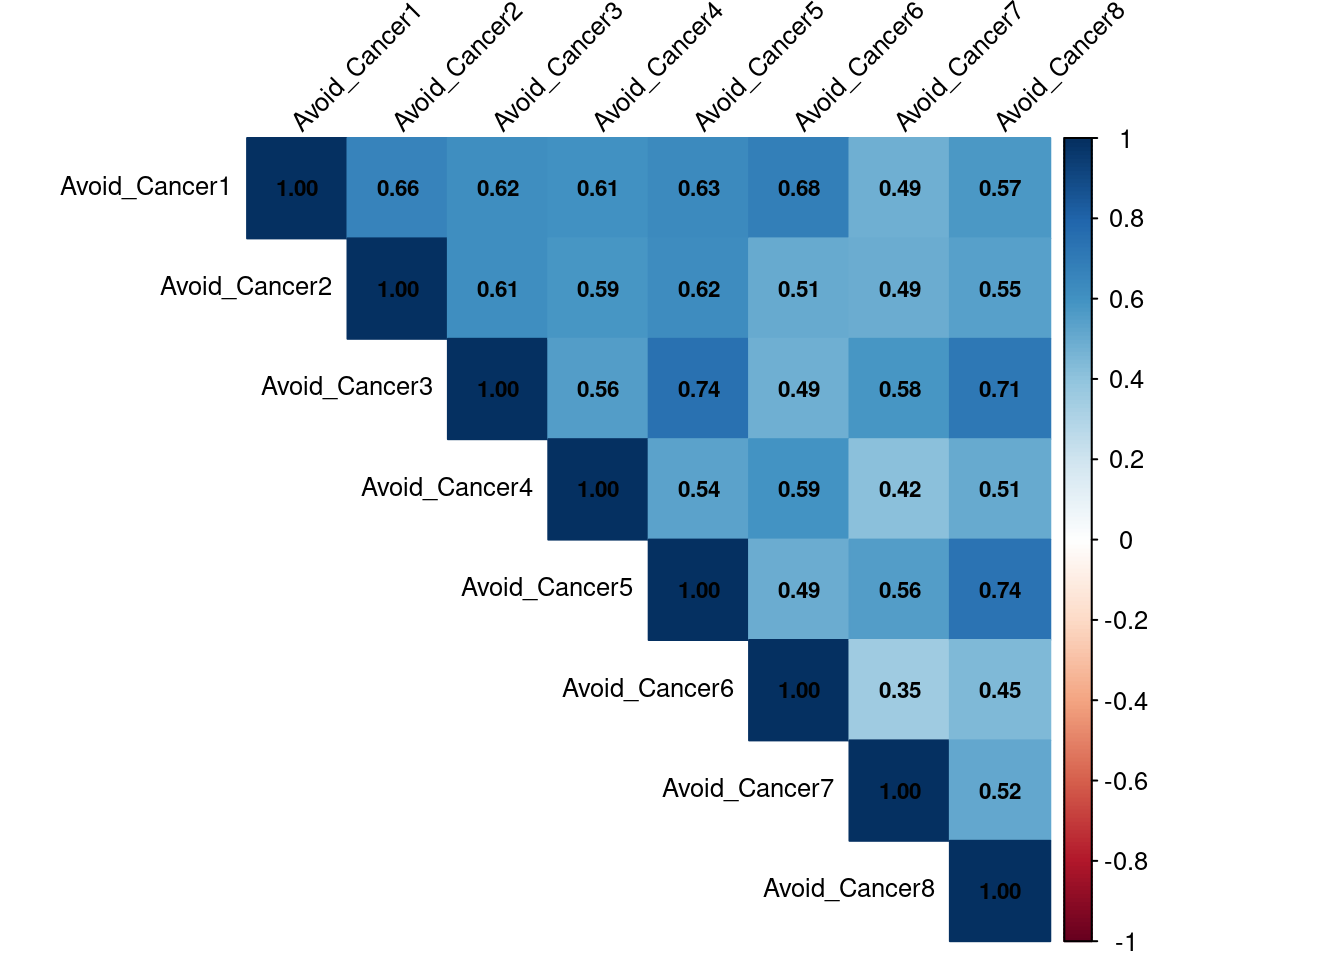
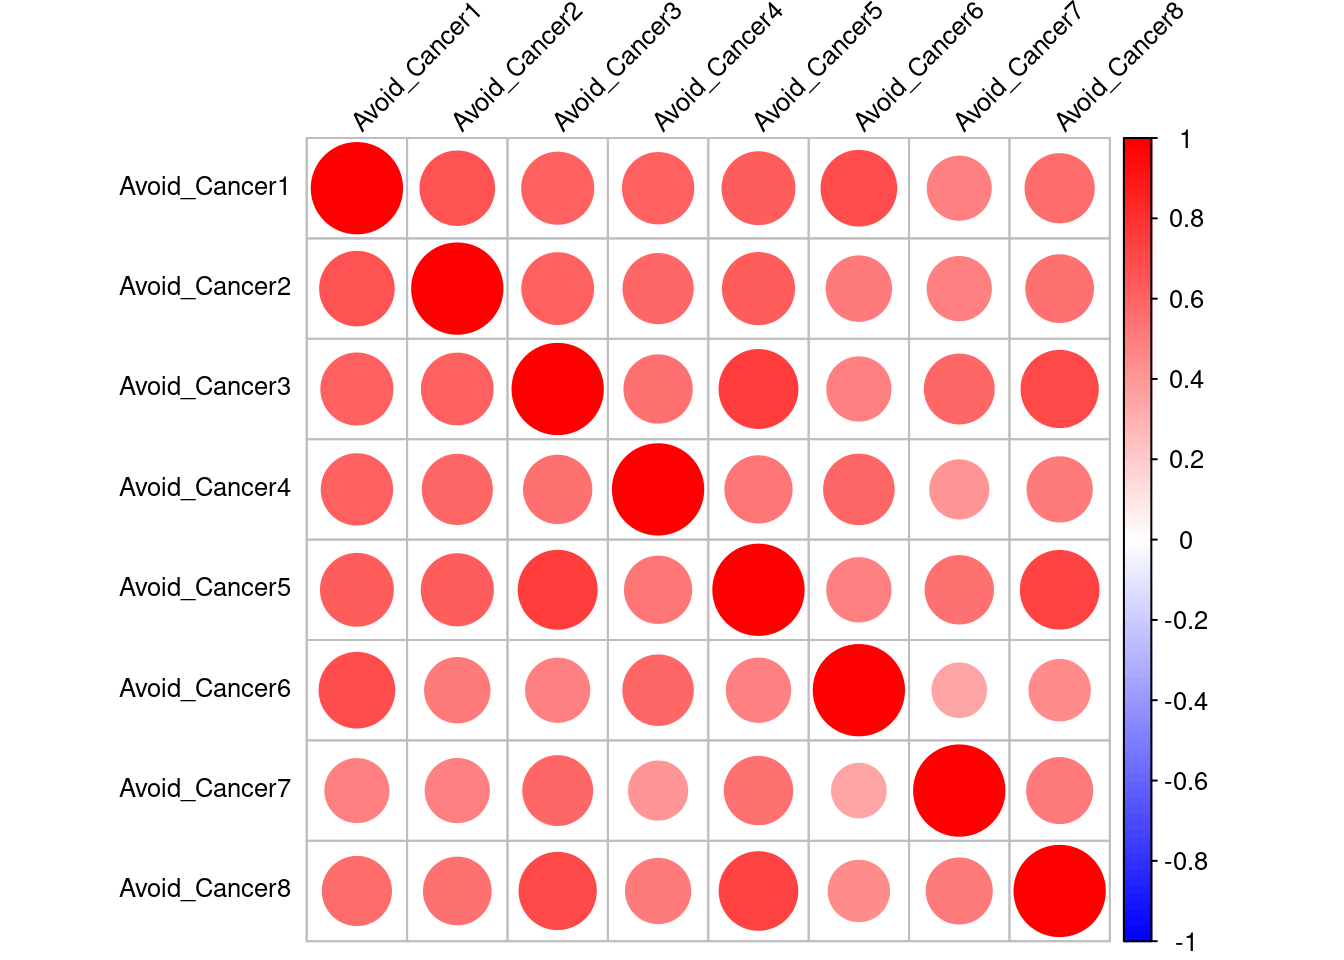
- All the 8 of the cancer items are moderate to high correlate with each other, so we can add them up and get the average score.
Alpha
Reliability analysis
Call: psych::alpha(x = selectdata[, c("Avoid_Cancer1", "Avoid_Cancer2",
    "Avoid_Cancer3", "Avoid_Cancer4", "Avoid_Cancer5", "Avoid_Cancer6",
    "Avoid_Cancer7", "Avoid_Cancer8")])

  raw_alpha std.alpha G6(smc) average_r S/N    ase mean   sd median_r
      0.91      0.91    0.91      0.57  10 0.0013  1.7 0.65     0.56

    95% confidence boundaries
         lower alpha upper
Feldt     0.91  0.91  0.91
Duhachek  0.91  0.91  0.91

 Reliability if an item is dropped:
              raw_alpha std.alpha G6(smc) average_r  S/N alpha se  var.r med.r
Avoid_Cancer1      0.89      0.90    0.89      0.55  8.6   0.0016 0.0098  0.54
Avoid_Cancer2      0.89      0.90    0.90      0.56  9.0   0.0015 0.0107  0.56
Avoid_Cancer3      0.89      0.90    0.89      0.55  8.5   0.0015 0.0085  0.54
Avoid_Cancer4      0.90      0.90    0.90      0.57  9.4   0.0014 0.0104  0.57
Avoid_Cancer5      0.89      0.90    0.89      0.55  8.5   0.0015 0.0079  0.55
Avoid_Cancer6      0.90      0.91    0.90      0.59  9.9   0.0013 0.0070  0.58
Avoid_Cancer7      0.91      0.91    0.91      0.59 10.2   0.0014 0.0070  0.59
Avoid_Cancer8      0.90      0.90    0.90      0.56  9.0   0.0015 0.0083  0.58

 Item statistics
                  n raw.r std.r r.cor r.drop mean   sd
Avoid_Cancer1 11214  0.85  0.83  0.82   0.78  1.8 0.90
Avoid_Cancer2 11214  0.79  0.80  0.76   0.73  1.6 0.77
Avoid_Cancer3 11214  0.83  0.84  0.83   0.78  1.6 0.74
Avoid_Cancer4 11214  0.78  0.76  0.71   0.69  1.9 0.93
Avoid_Cancer5 11214  0.83  0.84  0.83   0.78  1.6 0.76
Avoid_Cancer6 11214  0.75  0.72  0.68   0.65  2.3 1.02
Avoid_Cancer7 11214  0.67  0.70  0.63   0.59  1.4 0.59
Avoid_Cancer8 11214  0.79  0.80  0.77   0.72  1.7 0.83

Non missing response frequency for each item
              0    1    2    3    4 5 miss
Avoid_Cancer1 0 0.45 0.32 0.18 0.05 0    0
Avoid_Cancer2 0 0.56 0.32 0.10 0.03 0    0
Avoid_Cancer3 0 0.54 0.35 0.09 0.02 0    0
Avoid_Cancer4 0 0.42 0.27 0.26 0.05 0    0
Avoid_Cancer5 0 0.50 0.38 0.10 0.03 0    0
Avoid_Cancer6 0 0.29 0.23 0.36 0.12 0    0
Avoid_Cancer7 0 0.69 0.27 0.03 0.01 0    0
Avoid_Cancer8 0 0.53 0.31 0.12 0.04 0    0
Based on the analysis, the alpha does not improve for the measure if any of the items are dropped. All final alphas will be equal or lower than the 0.89 raw alpha and 0.9 standardized alpha.
The internal consistency of the
Information Avoidance – Canceritems was high (std.alpha = 0.895), suggesting that the items measured a coherent construct. The average inter-item correlation was (average_r = 0.55), indicating moderately strong associations among the items without redundancy. Reliability estimates (G6 = 0.894) further supported this consistency.
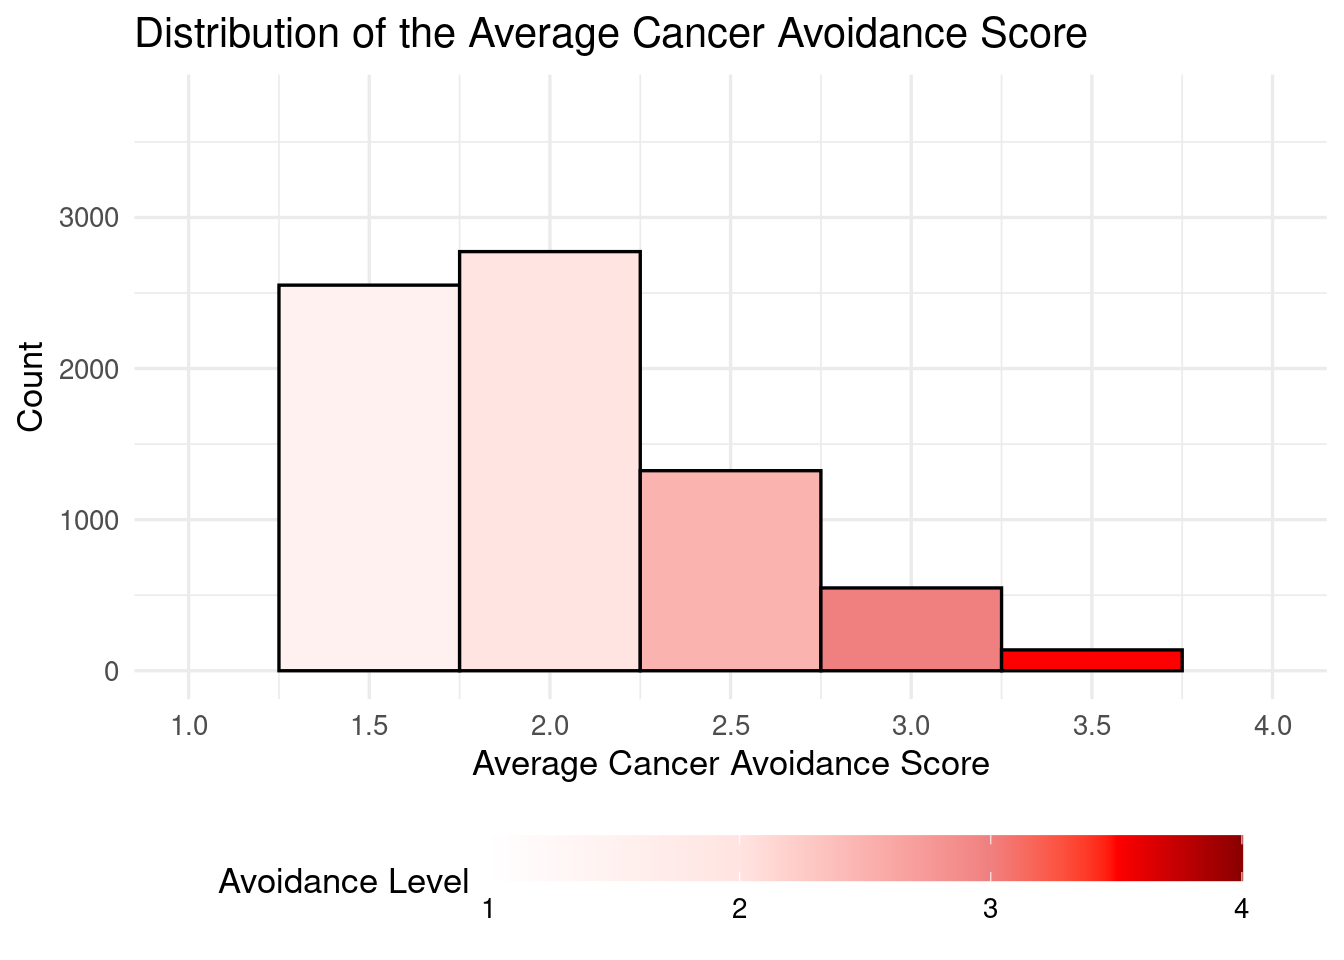
Percentage of participants with Cancer_Avoidance_Mean >= 2.5
[1] 14.35705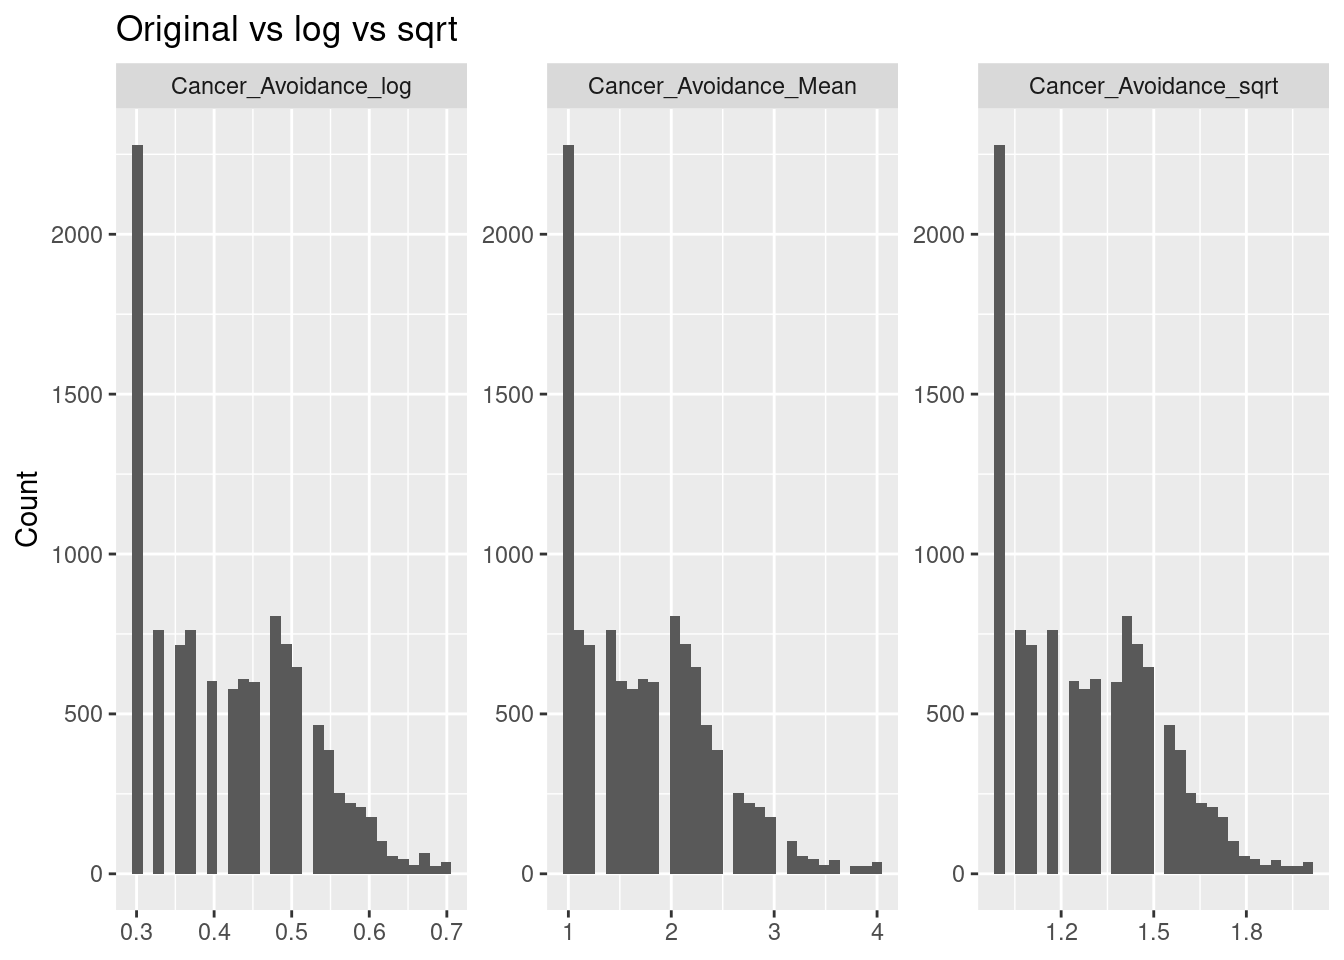
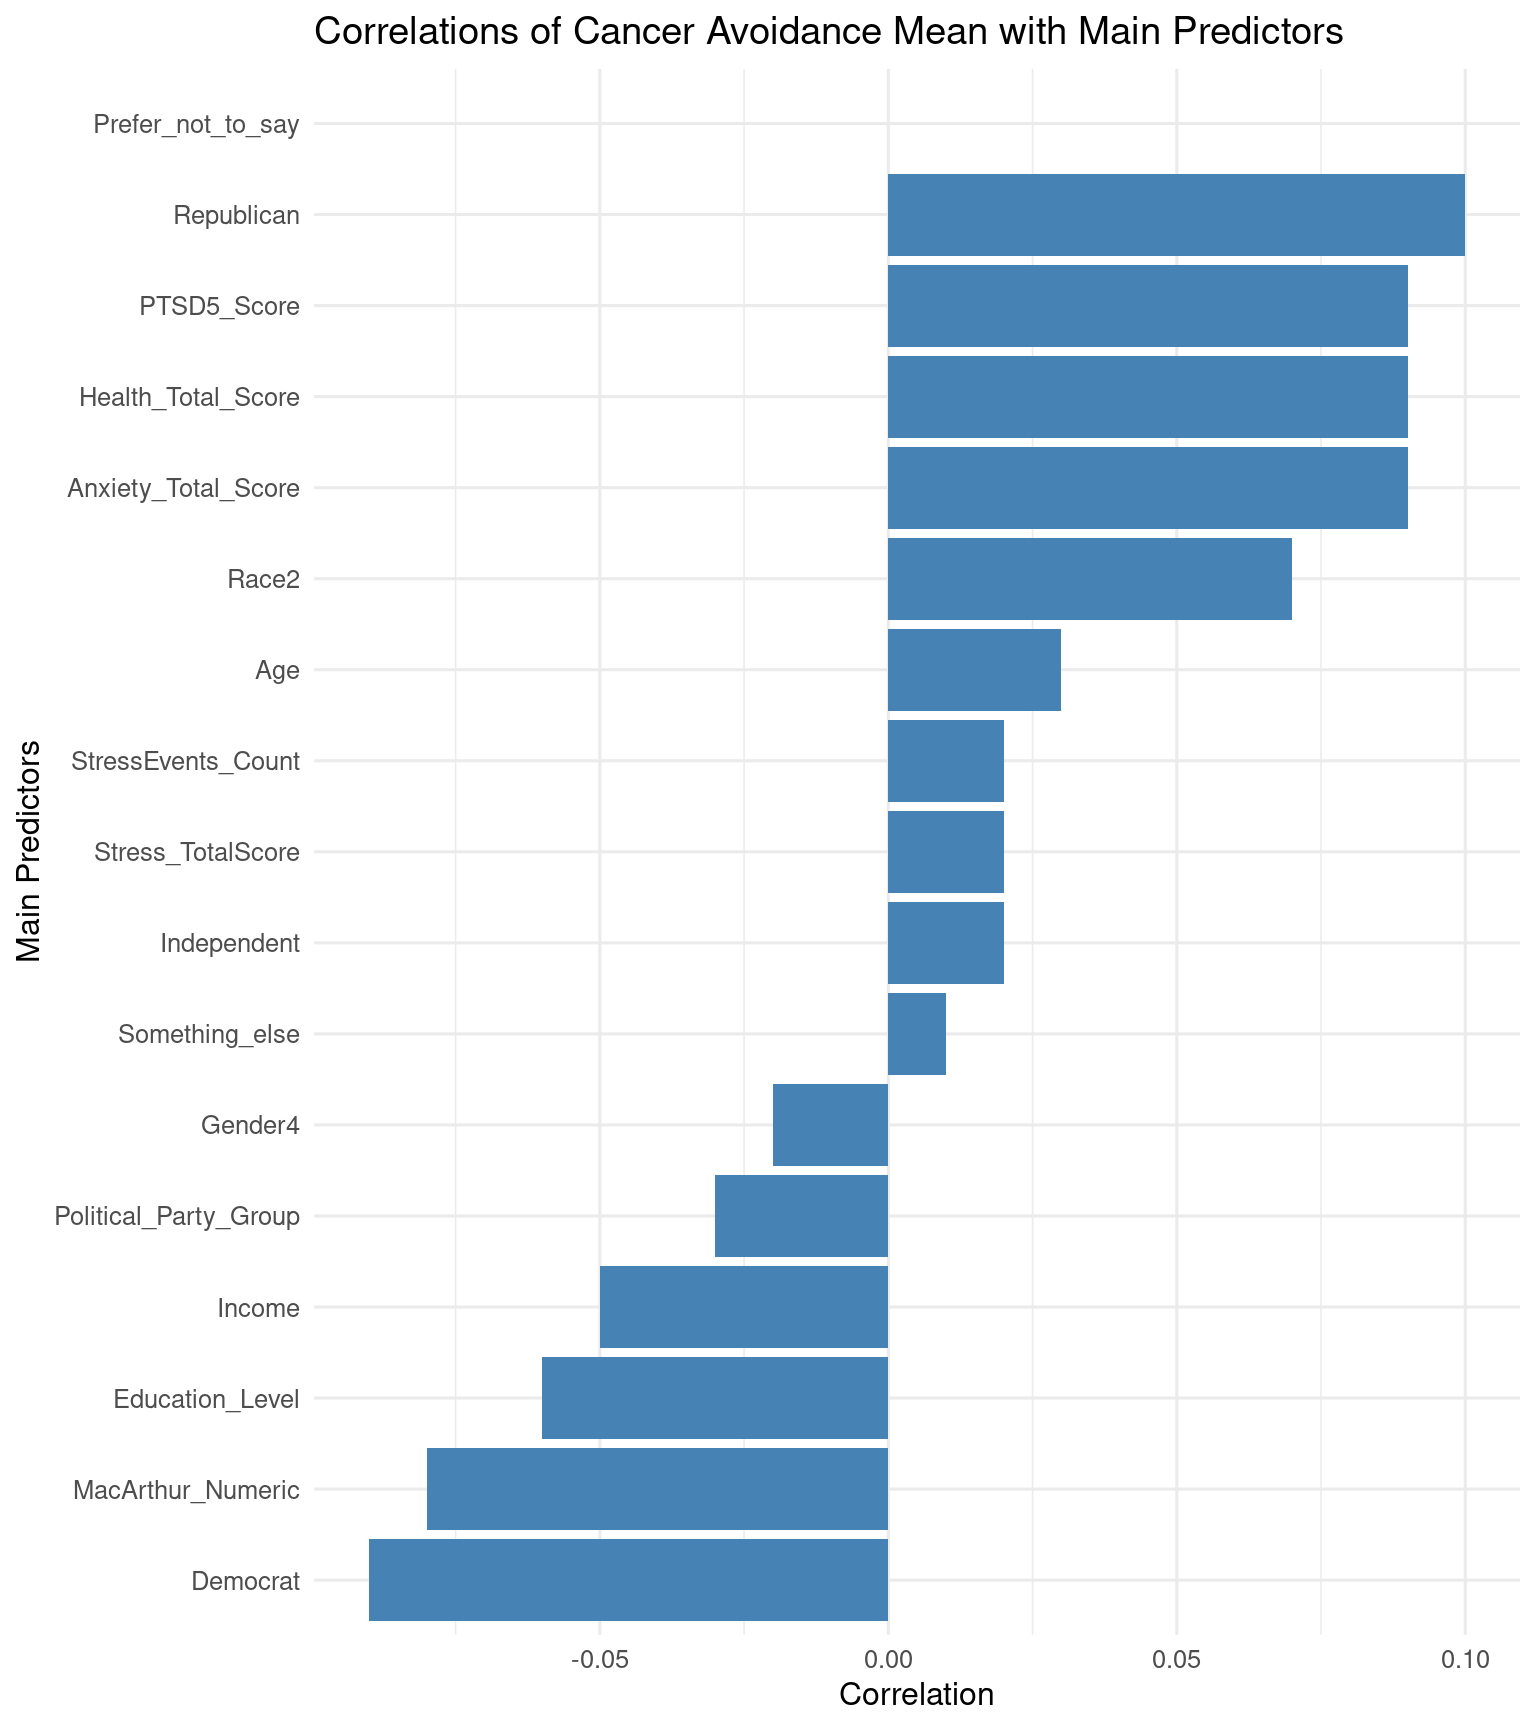
Matrix
| Predictor | Correlation |
|---|---|
| Age | 0.03 |
| Republican | 0.09 |
| Democrat | -0.09 |
| Independent | 0.01 |
| Something_else | 0.01 |
| Prefer_not_to_say | NA |
| Gender4 | -0.02 |
| Education_Level | -0.06 |
| Income | -0.05 |
| MacArthur_Numeric | -0.08 |
| Political_Party_Group | -0.03 |
| Race2 | 0.07 |
| Anxiety_Total_Score | 0.09 |
| PTSD5_Score | 0.09 |
| Health_Total_Score | 0.09 |
| StressEvents_Count | 0.02 |
| Stress_TotalScore | 0.03 |
Descriptive tables for categorical variables
| Variable | Value | n | percent |
|---|---|---|---|
| AI_Use | Missing | 41 | 0.4% |
| AI_Use | No | 2268 | 20.2% |
| AI_Use | Yes | 8905 | 79.4% |
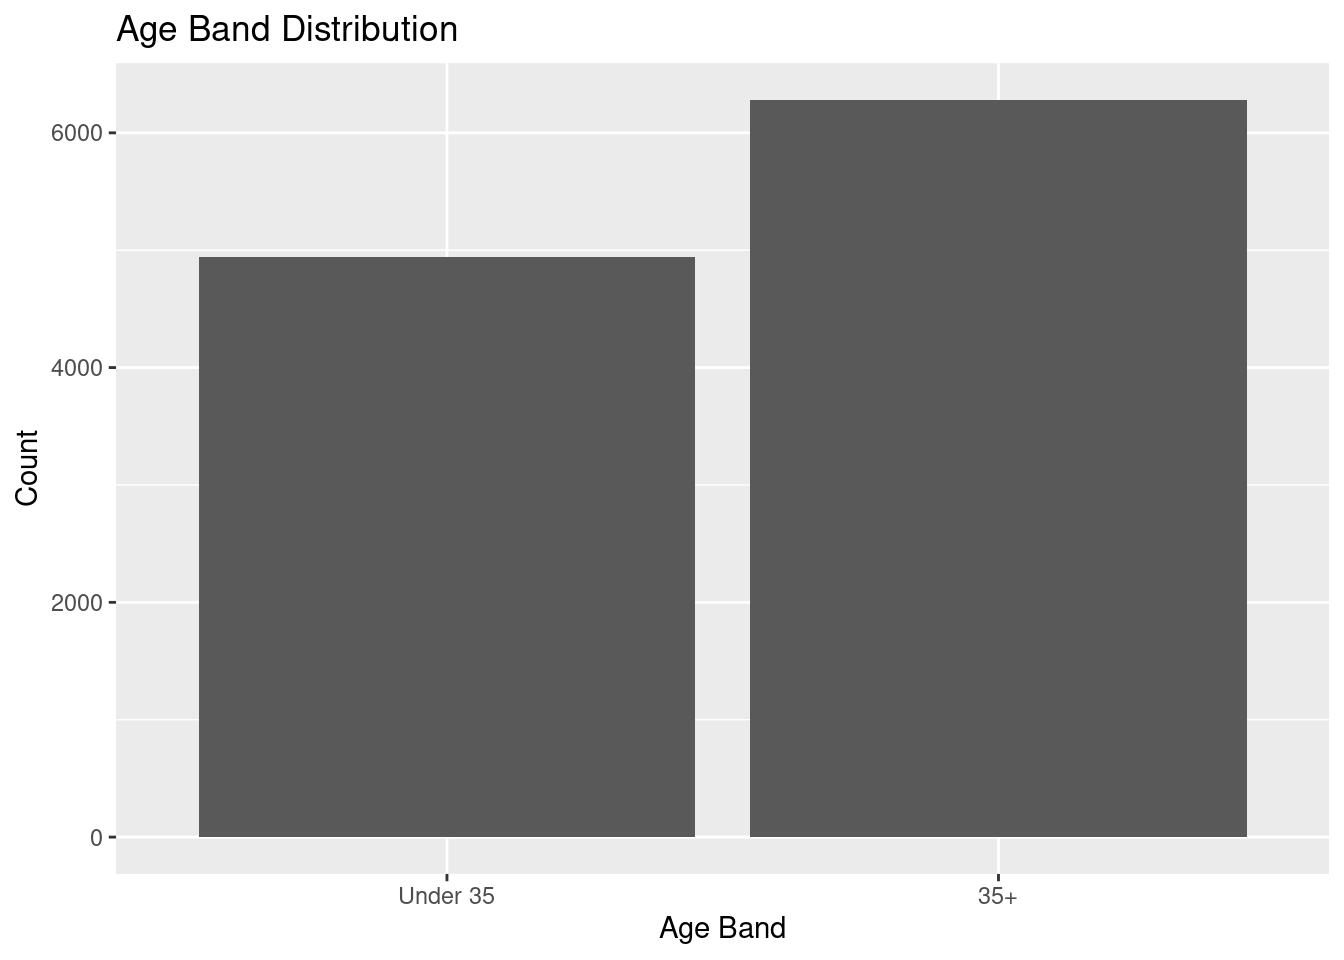
| AgeBand | 35+ | 6275 | 56% |
| AgeBand | Under 35 | 4939 | 44% |
| AgeGroup | 18–24 | 1377 | 12.3% |
| AgeGroup | 25–34 | 3562 | 31.8% |
| AgeGroup | 35–44 | 3089 | 27.5% |
| AgeGroup | 45–54 | 1738 | 15.5% |
| AgeGroup | 55–64 | 962 | 8.6% |
| AgeGroup | 65+ | 486 | 4.3% |
| Anxiety_Feeling_Afraid | Missing | 42 | 0.4% |
| Anxiety_Feeling_Afraid | More than half the days | 981 | 8.7% |
| Anxiety_Feeling_Afraid | Nearly every day | 688 | 6.1% |
| Anxiety_Feeling_Afraid | Not at all | 5865 | 52.3% |
REGRESSION MODELS
(continuous outcome Cancer_Avoidance_Mean)
Random Forest Analysis (tidymodel)
Demographic Model
| Metric | Value |
|---|---|
| RMSE | 0.629 |
| MAE | 0.525 |
| R-squared | 0.012 |
| Correlation | 0.107 |
RMSE (~0.63) and MAE (~0.53) are pretty close, meaning errors aren’t heavily dominated by outliers.
Correlation = 0.107 is extremely low. It basically means that predicted values do not track the actual values at all. So the model is not capturing the pattern in the test data.
If predictors have very weak relationships with the outcome, the model will predicts values near the mean of the training set.
The random forest model shows that
MacArthur_Numericis the most predict variable.
| Term | Estimate | Std Error | Statistic | p value |
|---|---|---|---|---|
| Intercept | 1.860 | 0.021 | 86.548 | 0e+00 |
| MacArthur Numeric | -0.025 | 0.004 | -6.362 | 2e-10 |
- The linear regression analysis shows a statistically significant negative relationship between MacArthur Scale scores and cancer avoidance mean (\(\beta\) = -0.025, p = 2e-10). For each one-unit increase in the MacArthur score (indicating higher subjective socioeconomic status), cancer avoidance mean scores decreased by 0.025 units.

The scatter plot displays a slight negative trend (indicated by the red regression line), but the data points are widely dispersed across all MacArthur score levels.
This visual pattern confirms the weak correlation, showing that while a statistical relationship exists, MacArthur score (subjective socioeconomic status) is not a strong predictor of cancer avoidance behaviors on its own.
| Estimate | Std. Error | t value | Pr(>|t|) | |
|---|---|---|---|---|
| (Intercept) | 1.701 | 0.019 | 89.860 | 0.000 |
| AgeGroup25–34 | -0.005 | 0.022 | -0.218 | 0.827 |
| AgeGroup35–44 | 0.060 | 0.023 | 2.604 | 0.009 |
| AgeGroup45–54 | 0.076 | 0.026 | 2.892 | 0.004 |
| AgeGroup55–64 | 0.064 | 0.032 | 2.014 | 0.044 |
| AgeGroup65+ | -0.039 | 0.047 | -0.830 | 0.407 |
The initial analysis examined cancer avoidance scores across six age categories, revealing that middle-aged adults (35-64) showed significantly higher cancer avoidance behaviors compared to the youngest group (18-24). However, the model explains only 0.33% of the variance (\(R^2\)= 0.003), indicating weak predictive power despite statistical significance.
So we break the
AgeGroupintoAgeBandwith only 2 categories “above 35” and “under 35” to see if the result will be better.
| Estimate | Std. Error | t value | Pr(>|t|) | |
|---|---|---|---|---|
| (Intercept) | 1.69710 | 0.01016 | 166.95821 | 0e+00 |
| AgeBand35+ | 0.06364 | 0.01405 | 4.52861 | 1e-05 |
Individuals aged 35 and older had cancer avoidance scores 0.063 units higher than those under 35 (p = 1e-05), a highly significant difference. The model remains weak in explanatory power (\(R^2\) = 0.0025), but the clear age threshold at 35 years provides a meaningful distinction for further investigation.
Now, we wanted to see if other predictors would influence the
AgeBandfor under 35 and over 35, so we created two multivariable linear regression models (Age_under35 and Age_over35) predicting Cancer Avoidance Mean.
| Estimate | Std. Error | t value | Pr(>|t|) | |
|---|---|---|---|---|
| (Intercept) | 1.92454187 | 0.04543598 | 42.3572259 | 0.00000000 |
| Education_Level | -0.00972813 | 0.00749041 | -1.2987443 | 0.19410946 |
| Income | 0.00230409 | 0.00593904 | 0.3879572 | 0.69806915 |
| MacArthur_Numeric | -0.01228816 | 0.00579063 | -2.1220774 | 0.03389491 |
| Political_PartyDemocrat | -0.16504871 | 0.03073285 | -5.3704339 | 0.00000008 |
| Political_PartyIndependent | -0.12011984 | 0.03329796 | -3.6074238 | 0.00031318 |
| Political_PartySomething else | -0.15447762 | 0.04019667 | -3.8430452 | 0.00012348 |
| Political_PartyPrefer not to say | -0.15013291 | 0.04971503 | -3.0198695 | 0.00254543 |
For individuals under 35, political party affiliation emerged as the strongest predictor of cancer avoidance. Democrats showed 0.165 lower scores than Republicans (p = 8.97e-08), Independents showed 0.120 lower scores (p = 0.0003), and those selecting “Something else” showed 0.155 lower scores (p = 0.0001).
But the overall model explaining less than 1% of variance (\(R^2\) = 0.0097).

- The bar plots shows predicted cancer avoidance means across political affiliations, stratified by age. For those under 35, Republicans show the highest cancer avoidance behaviors (~1.80), while all other political groups cluster around 1.65, with error bars indicating moderate variability.
| Estimate | Std. Error | t value | Pr(>|t|) | |
|---|---|---|---|---|
| (Intercept) | 2.160 | 0.044 | 48.839 | 0.000 |
| Education_Level | -0.011 | 0.008 | -1.349 | 0.178 |
| Income | -0.016 | 0.007 | -2.286 | 0.022 |
| MacArthur_Numeric | -0.029 | 0.007 | -4.499 | 0.000 |
| Political_PartyDemocrat | -0.225 | 0.028 | -7.935 | 0.000 |
| Political_PartyIndependent | -0.131 | 0.030 | -4.368 | 0.000 |
| Political_PartySomething else | -0.138 | 0.041 | -3.397 | 0.001 |
| Political_PartyPrefer not to say | -0.093 | 0.057 | -1.632 | 0.103 |
For individuals aged 35 and older, political party affiliation showed even stronger effects than in the younger cohort. Democrats had 0.225 lower cancer avoidance scores than Republicans (p = 2.67e-15), Independents had 0.131 lower scores (p = 1.28e-05), and “Something else” respondents had 0.138 lower scores (p = 0.0007).
Additionally, both income (\(\beta\) = -0.016, p = 0.022) and MacArthur score (\(\beta\) = -0.029, p = 7.00e-06) showed significant negative associations, with this model explaining 2.8% of the variance (\(R^2\) = 0.028), the highest among all models tested.
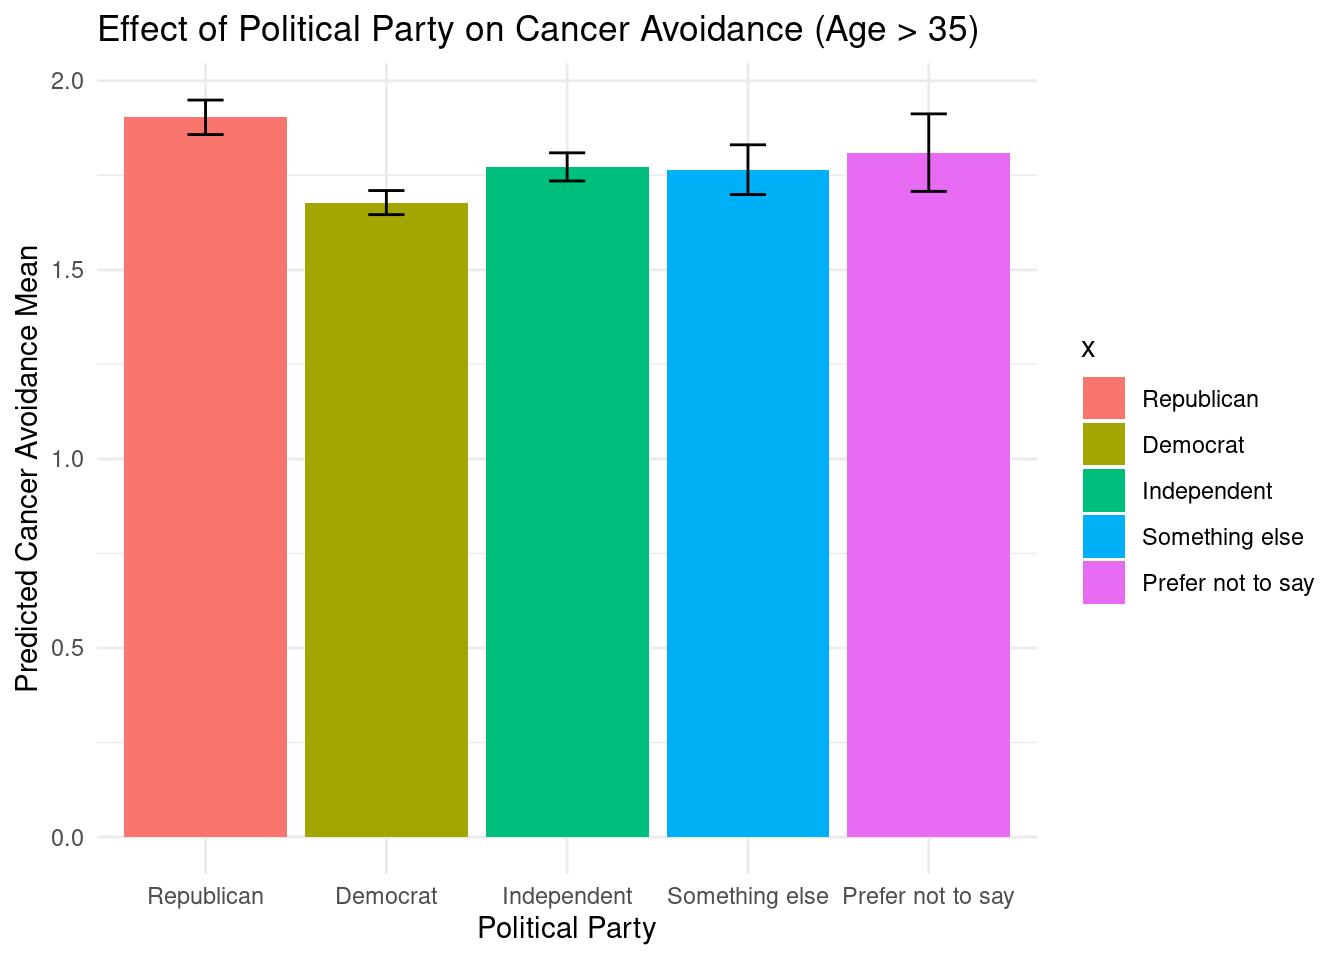
The bar plots shows predicted cancer avoidance means across political affiliations, stratified by age. For those 35 and older, Republicans maintain the highest scores (~1.93), while Democrats show notably lower scores (~1.68), and other groups fall in between.
There has been a consistent gap between Republicans and Democrats in the two age groups. Republicans exhibited higher levels of cancer avoidance scores, suggesting that political party is strongly associated with these avoidance behaviors regardless of age, although this effect is more pronounced in older adults.
Media Use Model
| Metric | Value |
|---|---|
| RMSE | 0.657 |
| MAE | 0.543 |
| R-squared | 0.003 |
| Correlation | 0.059 |
RMSE (~0.66) and MAE (~0.55) are pretty close, meaning errors aren’t heavily dominated by outliers.
Correlation = 0.059 is extremely low. It basically means that predicted values do not track the actual values at all. So the model is not capturing the pattern in the test data.
If predictors have very weak relationships with the outcome, the model will predicts values near the mean of the training set.
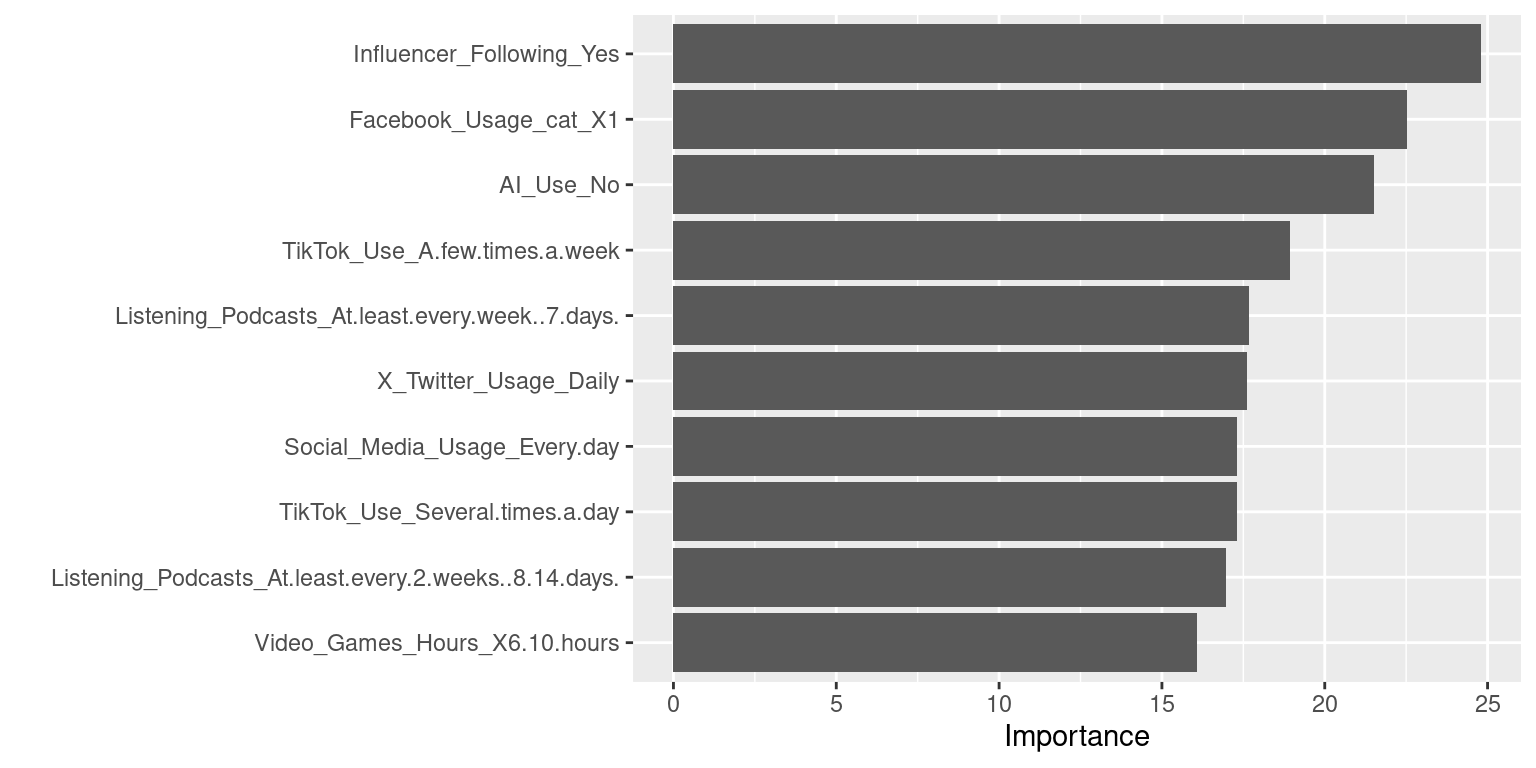
The random forest model shows that
Influencer_Followingis the most predictive variable.
| Estimate | Std. Error | t value | Pr(>|t|) | |
|---|---|---|---|---|
| (Intercept) | 1.752 | 0.020 | 85.723 | 0.000 |
| Influencer_FollowingUnsure | -0.042 | 0.057 | -0.730 | 0.465 |
| Influencer_FollowingYes | -0.012 | 0.022 | -0.523 | 0.601 |
- The linear regression analysis shows a none meaningful relationship between Influencer_Following scores and cancer avoidance mean (p > 0.05).
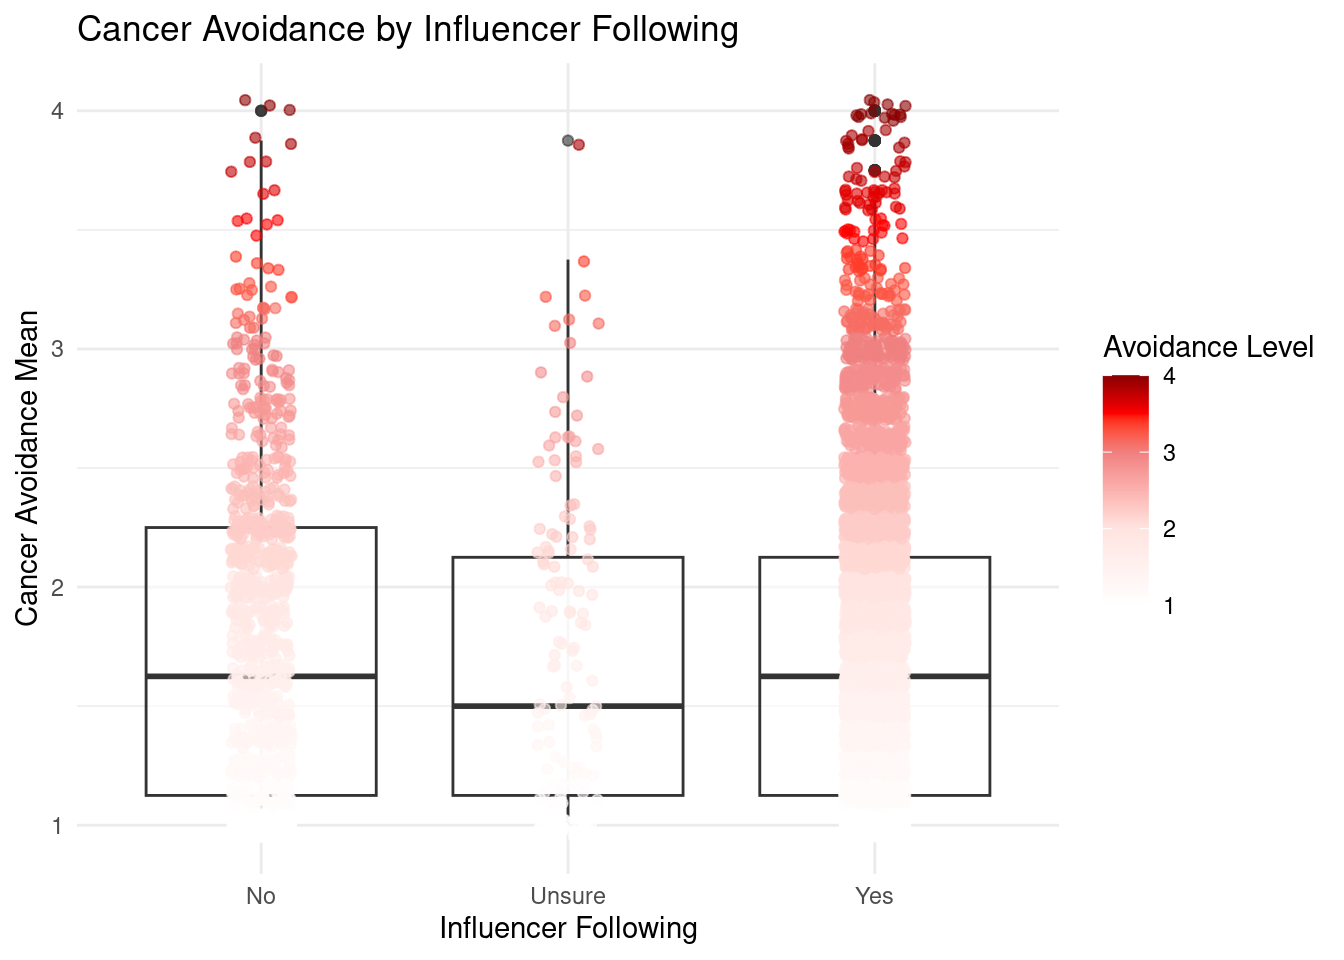
- The boxplot examining cancer avoidance scores across influencer following categories (No, Unsure, Yes) reveals remarkably similar distributions across all three groups. This visual pattern strongly supports the conclusion that influencer following status has no substantial relationship with cancer avoidance score.
Health Condition Model
| Metric | Value |
|---|---|
| RMSE | 0.660 |
| MAE | 0.551 |
| R-squared | 0.009 |
| Correlation | 0.093 |
RMSE (~0.66) and MAE (~0.55) are pretty close, meaning errors aren’t heavily dominated by outliers.
Correlation = 0.093 is extremely low. It basically means that predicted values do not track the actual values at all. So the model is not capturing the pattern in the test data.
If predictors have very weak relationships with the outcome, the model will predicts values near the mean of the training set.
The random forest model shows that
Stress_TotalScoreis the most predict variable.
| Estimate | Std. Error | t value | Pr(>|t|) | |
|---|---|---|---|---|
| (Intercept) | 1.726 | 0.014 | 121.639 | 0.000 |
| Stress_TotalScore | 0.005 | 0.003 | 1.908 | 0.056 |
- The linear regression analysis shows a none meaningful relationship between stress total scores and cancer avoidance mean (p > 0.05).
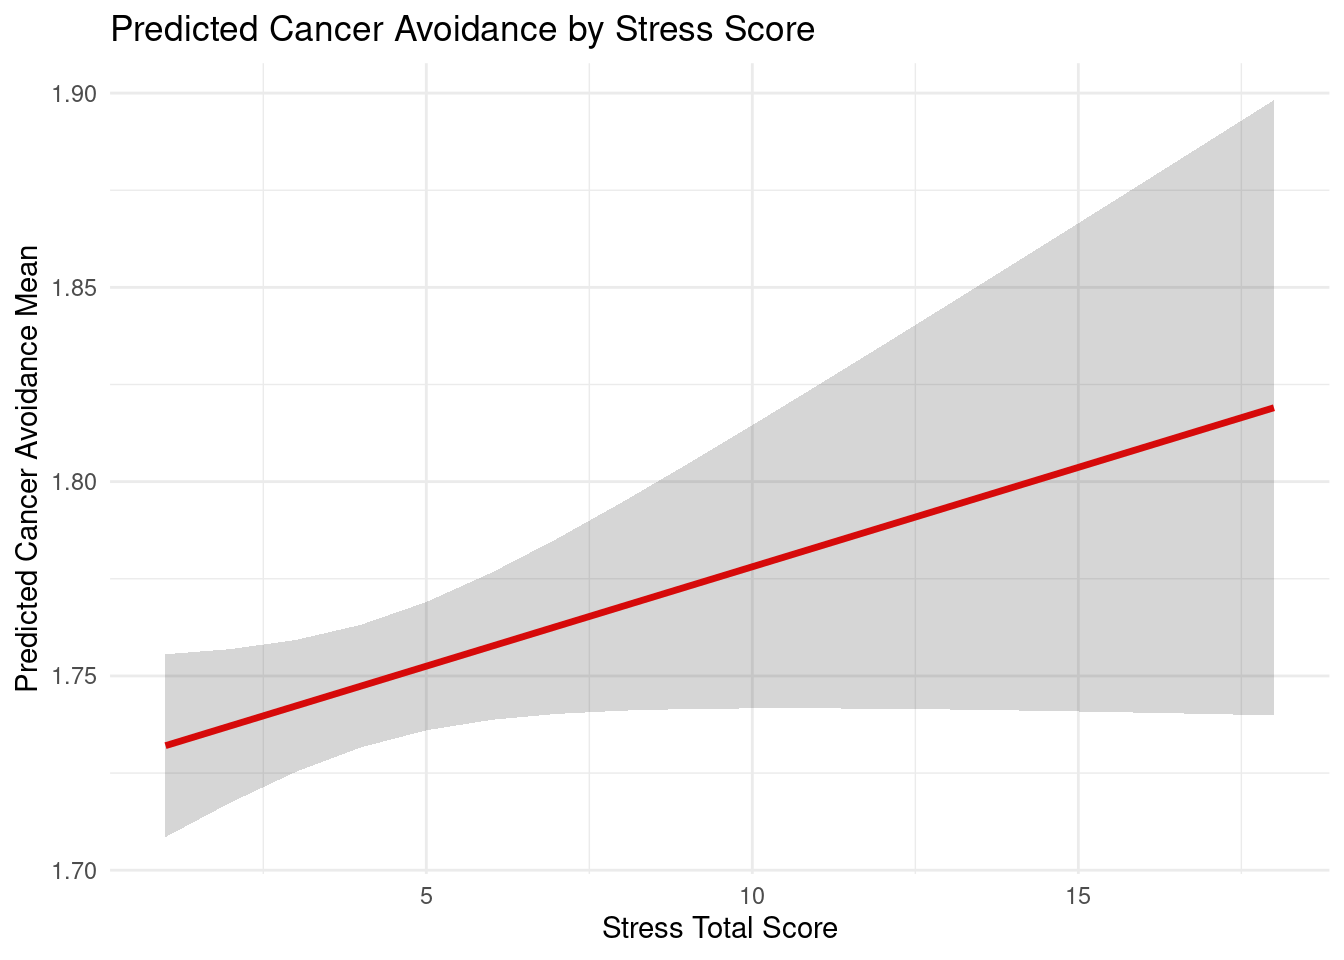
- The plot displays predicted cancer avoidance scores across the range of stress total scores (0-18), showing a slight positive trend indicated by the red regression line. The broad gray confidence band around the regression line reflects the considerable uncertainty in these predictions. While higher stress levels may be weakly associated with slightly higher cancer avoidance behaviors, but this relationship is not statistically significant.
Health Behavior Model
| Metric | Value |
|---|---|
| RMSE | 0.653 |
| MAE | 0.543 |
| R-squared | 0.003 |
| Correlation | 0.053 |
RMSE (~0.65) and MAE (~0.54) are pretty close, meaning errors aren’t heavily dominated by outliers.
Correlation = 0.053 is extremely low. It basically means that predicted values do not track the actual values at all. So the model is not capturing the pattern in the test data.
If predictors have very weak relationships with the outcome, the model will predicts values near the mean of the training set.
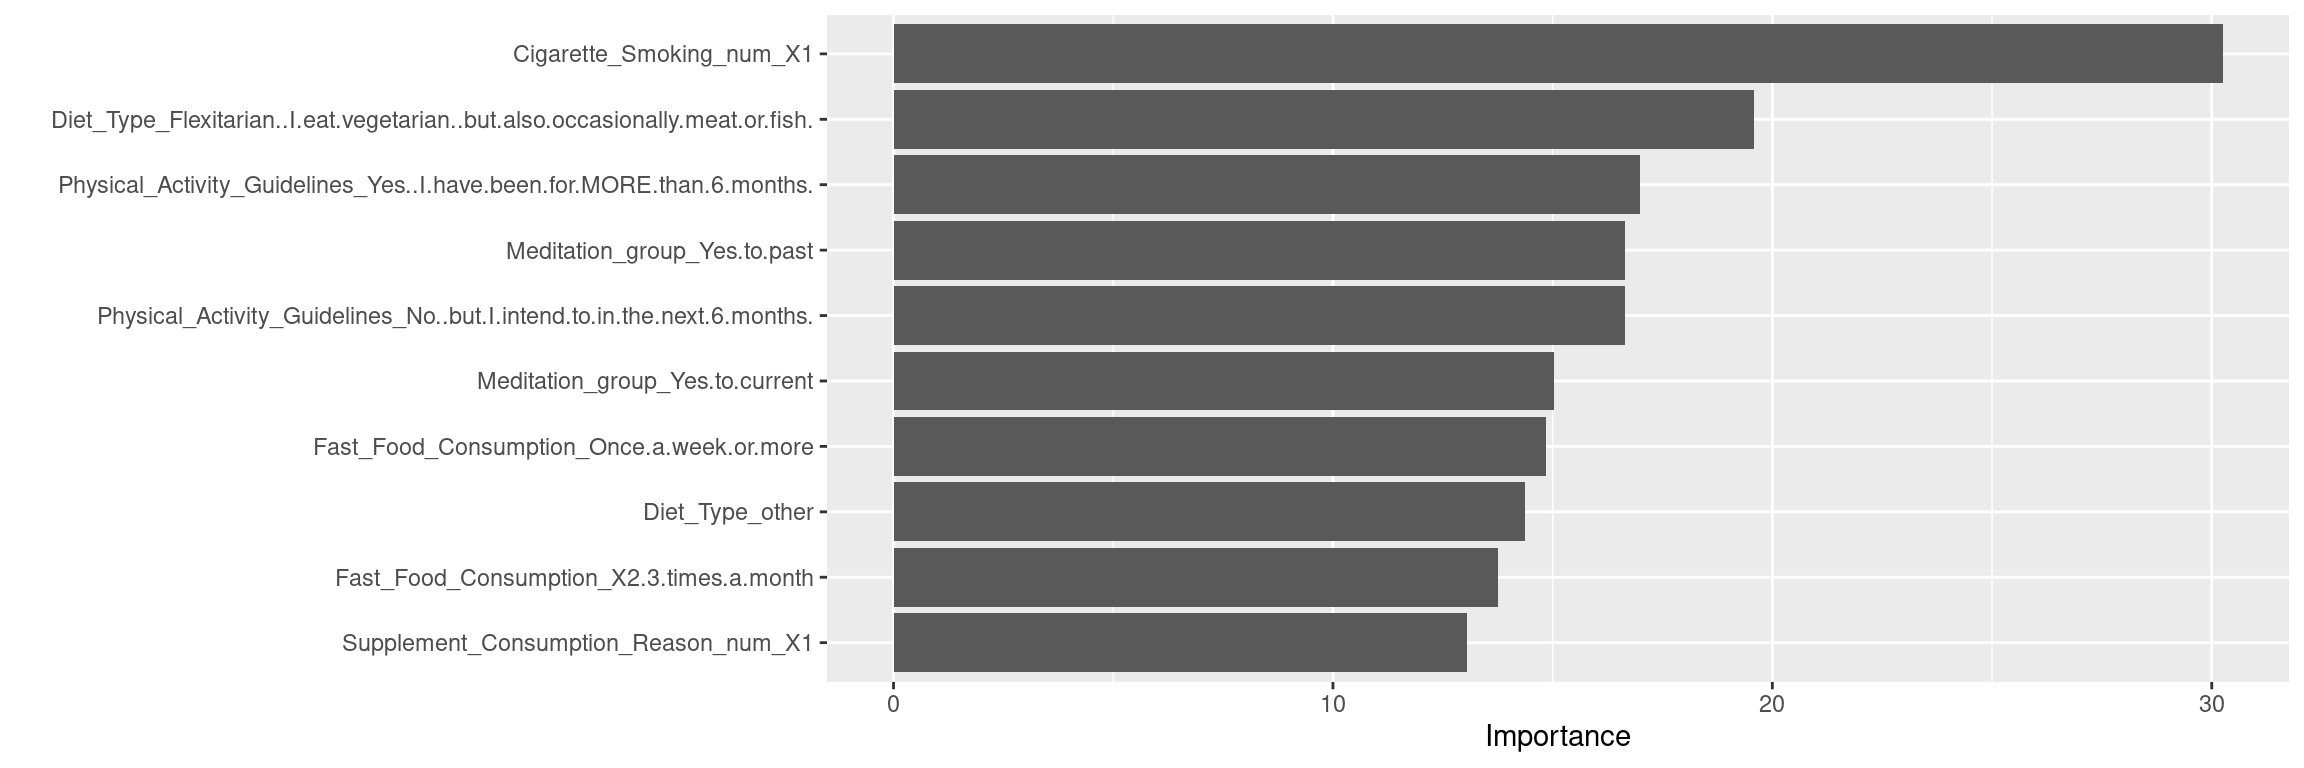
The random forest model shows that number of
Cigarette_Smokingis the most predict variable.
| Estimate | Std. Error | t value | Pr(>|t|) | |
|---|---|---|---|---|
| (Intercept) | 1.709 | 0.008 | 202.209 | 0 |
| Cigarette_Smoking_num1 | 0.185 | 0.021 | 8.842 | 0 |
The linear regression analysis shows a statistically significant positive relationship between cigarette smoking and cancer avoidance behaviors (\(\beta\) = 0.185, p < 2e-16). For every one-unit increase in cigarette smoking status (from non-smoker to smoker), the predicted cancer avoidance score increases by 0.185 units, meaning individuals who smoke tend to have slightly higher cancer avoidance scores.
While this relationship is conventionally significant at the 0.05 level, the model explains only 1.1% of the variance (\(R^2\) = 0.011), indicating that smoking status alone provides minimal predictive power for cancer avoidance scores.
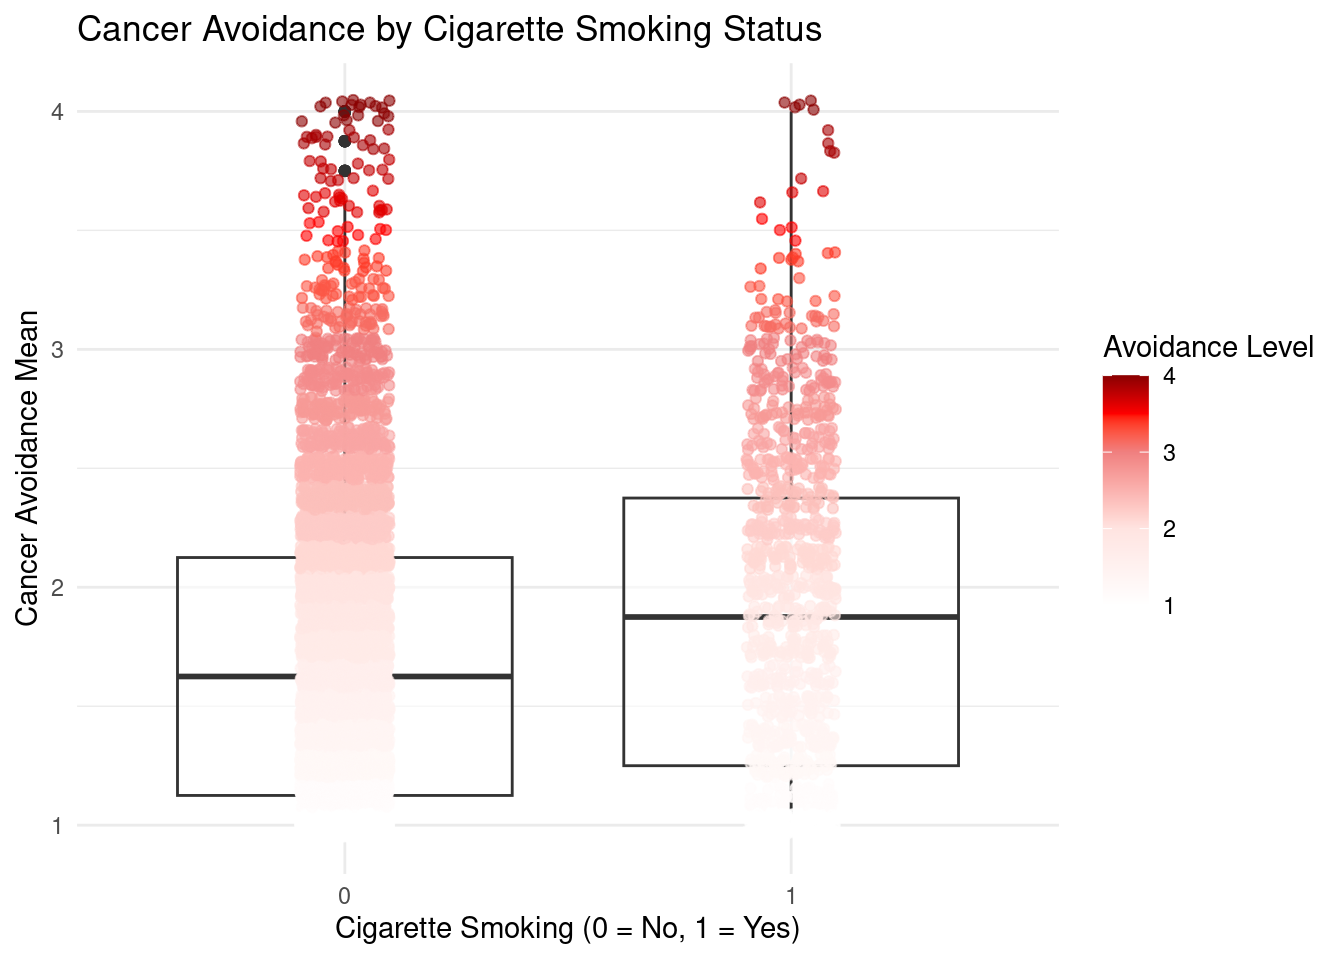
- Look at the box plot, smokers show higher cancer avoidance scores on average compared to non-smokers. This could mean that smokers are more aware of or concerned about cancer risks, possibly leading them to engage in other cancer-preventive behaviors. However, the low variance reminds us that while this pattern is statistically significant, smoking status explains only a small fraction of the variation in cancer avoidance scores.
Other Model
| Metric | Value |
|---|---|
| RMSE | 0.628 |
| MAE | 0.526 |
| R-squared | 0.024 |
| Correlation | 0.155 |
RMSE (~0.63) and MAE (~0.53) are pretty close, meaning errors aren’t heavily dominated by outliers.
Correlation = 0.155 is extremely low. It basically means that predicted values do not track the actual values at all. So the model is not capturing the pattern in the test data.
If predictors have very weak relationships with the outcome, the model will predicts values near the mean of the training set.
The random forest model shows that
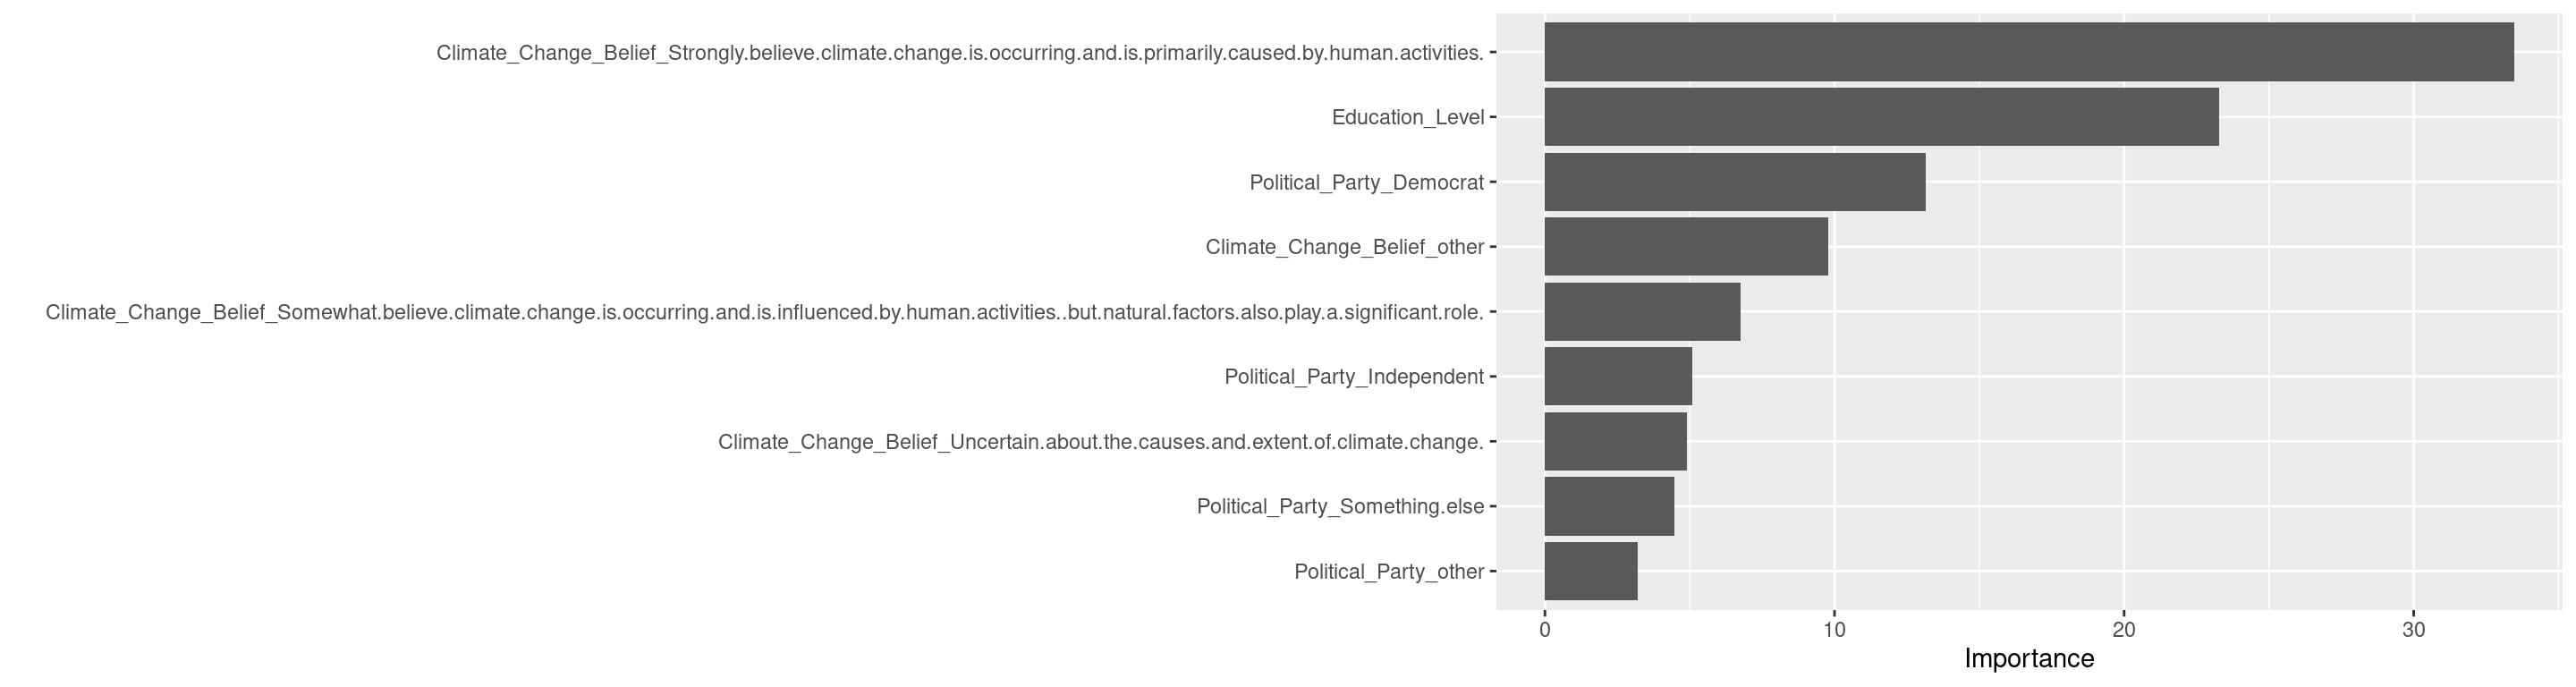
Climate_Change_Belief(Strongly believe climate change is occurring and is primarily caused by human activities) is the most predict variable.
| Estimate | Std. Error | t value | Pr(>|t|) | |
|---|---|---|---|---|
| (Intercept) | 1.922 | 0.036 | 53.859 | 0.000 |
| Climate_Change_BeliefSomewhat skeptical about the impact of human activities on climate change, believing that climate change is a natural cycle. | -0.027 | 0.046 | -0.583 | 0.560 |
| Climate_Change_BeliefUncertain about the causes and extent of climate change. | -0.063 | 0.048 | -1.317 | 0.188 |
| Climate_Change_BeliefNo opinion on the matter. | 0.069 | 0.066 | 1.047 | 0.295 |
| Climate_Change_BeliefSomewhat believe climate change is occurring and is influenced by human activities, but natural factors also play a significant role. | -0.124 | 0.038 | -3.240 | 0.001 |
| Climate_Change_BeliefStrongly believe climate change is occurring and is primarily caused by human activities. | -0.270 | 0.037 | -7.286 | 0.000 |
- The linear regression shows significant associations between climate change beliefs and cancer avoidance scores. Individuals who strongly believe in human-caused climate change showed significantly lower cancer avoidance scores (\(\beta\) = -0.27, p = 3.32e-13), meaning their scores were 0.27 units lower on average. The model explains 2.4% of the variance (\(R^2\) = 0.024), indicating a weak but statistically significant relationship.
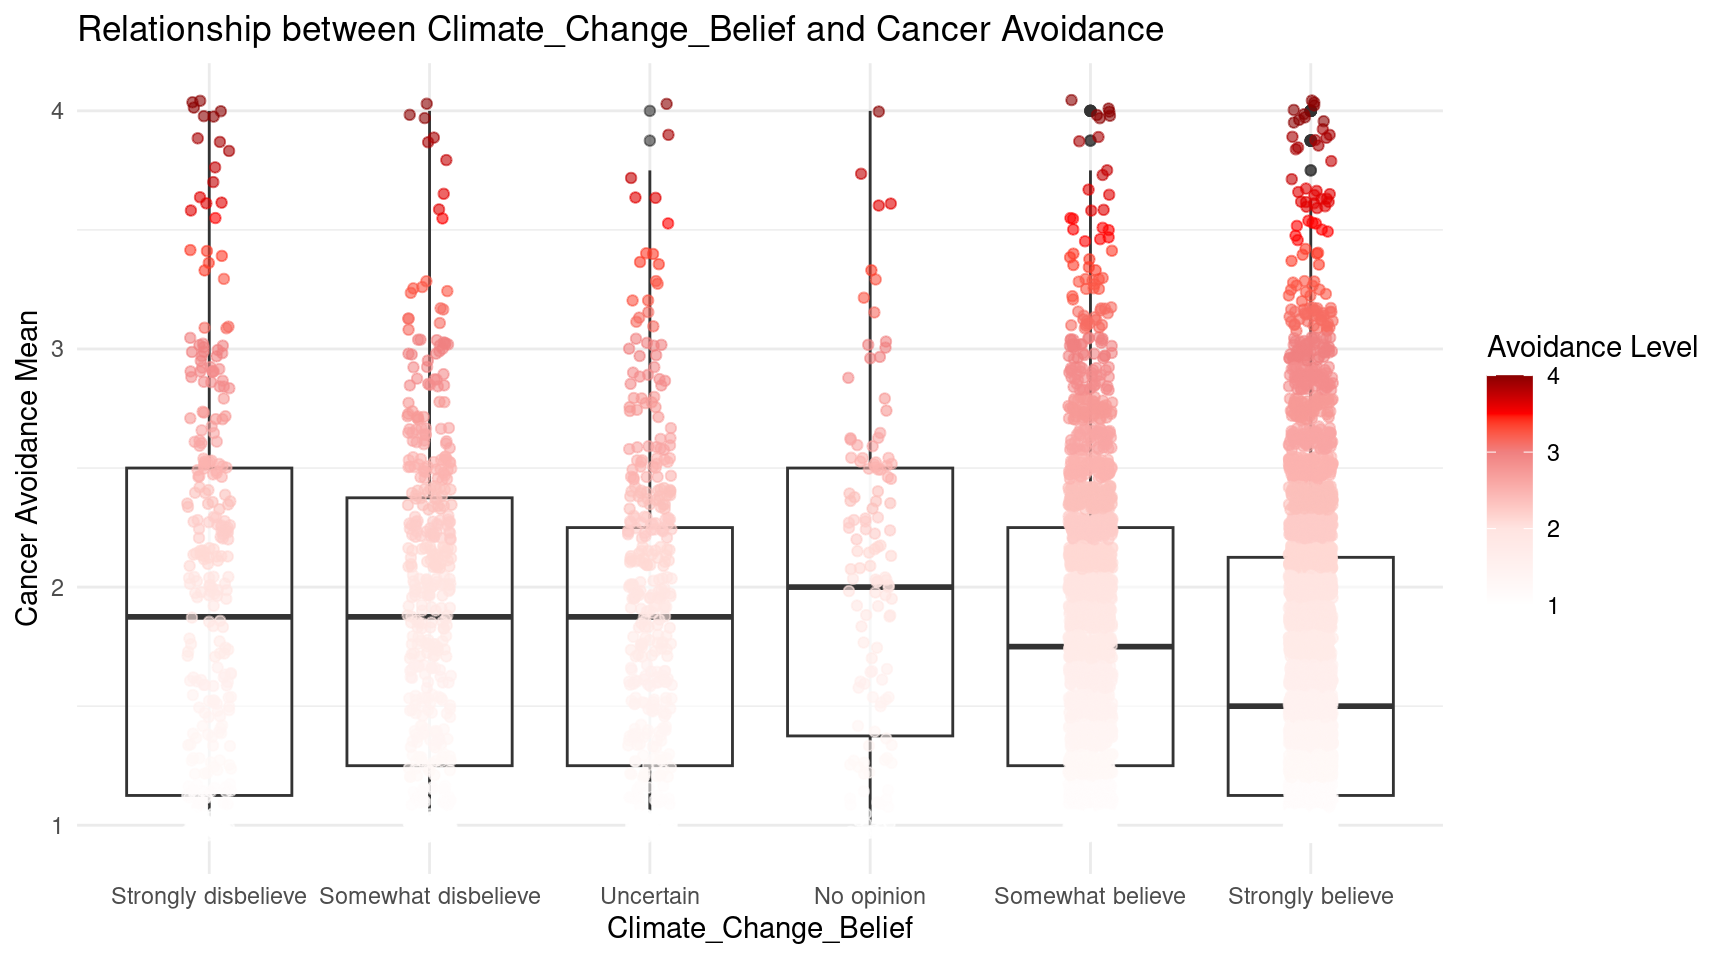
- The boxplot displays cancer avoidance behaviors across six climate change belief categories, revealing a clear gradient pattern. Climate change deniers and no opinion show higher median cancer avoidance scores around 1.9 - 2, with relatively compact distributions. Which means Individuals who strongly believe in human-caused climate change showed significantly lower cancer avoidance scores. However, the low variance reminds us that while this pattern is statistically significant, undefined explains only a small fraction of the variation in cancer avoidance scores.
Multivariate Adaptive Regression Splines (MARS)
Demographic
| Term | Coefficient |
|---|---|
| (Intercept) | 1.757 |
| Political_PartyDemocrat | -0.193 |
| h(8-MacArthur_Numeric) | 0.023 |
| h(Age-57) | -0.015 |
| h(57-Age) | -0.002 |
| RaceWhite | 0.064 |
| Job_ClassificationProfessional | -0.082 |
| Political_PartyIndependent | -0.122 |
| Political_PartySomething else | -0.123 |
| Political_PartyPrefer not to say | -0.127 |
| Job_ClassificationBlue Collar | 0.124 |
| h(3-Gender4) | 0.035 |
| Variable | N Subsets | GCV | RSS |
|---|---|---|---|
| Political_PartyDemocrat | 6 | 1 | 11 |
| MacArthur_Numeric | 37 | 1 | 10 |
| RaceWhite | 33 | 1 | 9 |
| Job_ClassificationProfessional | 17 | 1 | 8 |
| Political_PartyIndependent | 7 | 1 | 7 |
| Political_PartySomething else | 8 | 1 | 6 |
| Political_PartyPrefer not to say | 9 | 1 | 4 |
| Age | 21 | 1 | 4 |
| Gender4 | 10 | 1 | 2 |
| Job_ClassificationBlue Collar | 16 | 1 | 2 |
| Metric | Value |
|---|---|
| Selected Terms | 12.000 |
| R-squared | 0.026 |
| GRSq | 0.018 |
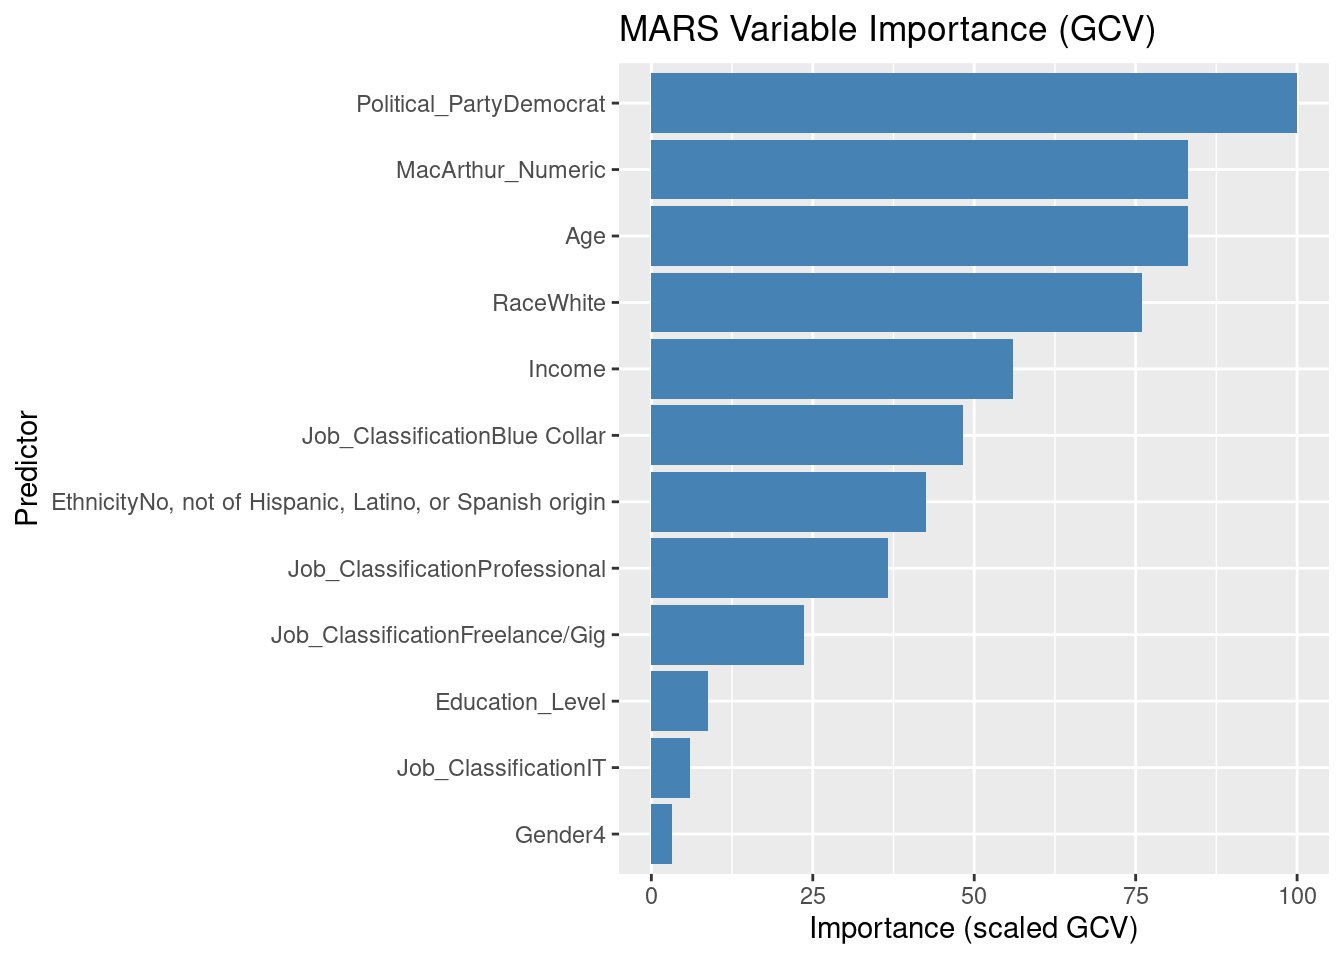
Political_PartyDemocratis the most influential predictor (baseline = 100).MacArthur_Numericis about 79% as important.RaceWhiteis about 64%.
| Term | Coefficient |
|---|---|
| (Intercept) | 1.651 |
| Political_PartyDemocrat | -0.185 |
| h(8-MacArthur_Numeric) | 0.055 |
| h(Age-57) | -0.016 |
| h(68-Age)*h(8-MacArthur_Numeric) | -0.002 |
| RaceWhite | 0.162 |
| Political_PartyIndependent*h(57-Age) | -0.005 |
| Job_ClassificationBlue Collar*h(57-Age) | 0.007 |
| Political_PartySomething else*h(57-Age) | -0.005 |
| h(Income-2)*RaceWhite | -0.042 |
| Metric | Value |
|---|---|
| Selected Terms | 19.0000 |
| R-squared | 0.0423 |
| GRSq | 0.0269 |
| Terms | Cancer_Avoidance_Mean | mean |
|---|---|---|
| fold7 | 0.0318 | 0.0318 |
| fold8 | 0.0251 | 0.0251 |
| fold9 | -0.0020 | -0.0020 |
| fold10 | 0.0121 | 0.0121 |
| mean | 0.0043 | 0.0043 |
Interactions appear as products (such as):
Ethnicity Prefer not to say * Political_Party Democrat = an interaction term between ethnicity and political party.
Selected model at 17 terms
GRSq/RSq converging around 0.03-0.04
Mean out-of-fold RSq near zero (poor predictive performance)
High cross-validation error (CVRSq = 0.017, sd = 0.019)
This suggests demographic variables don’t explain Cancer_Avoidance_Mean very well.
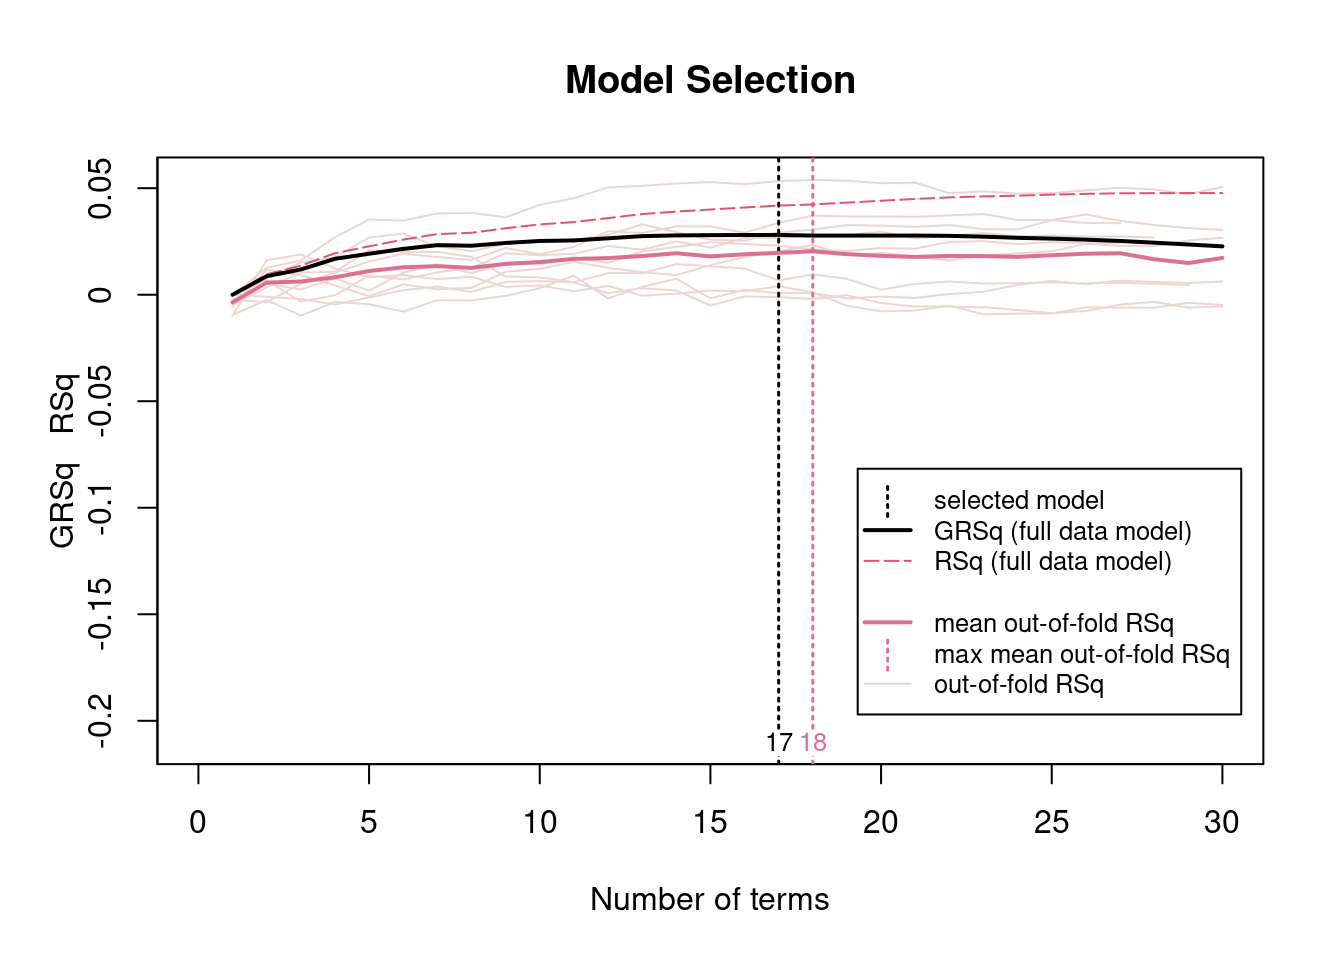
The model selection plot shows that both RSq (training fit) and GRSq (generalized R-square) values remain low. This indicates that demographic characteristics provide limited explanatory power for cancer avoidance mean, and adding nonlinear terms does not meaningfully improve predictive accuracy.
Demographics status explain very little of the variation in cancer avoidance. Where effects appear, they are narrow interactions, such as between political affiliation and ethnicity, or between Job_Classification Blue Collar and MacArthur_Numeric > 3.
Health condition
| Term | Coefficient |
|---|---|
| (Intercept) | 1.720 |
| h(Anxiety_Severity_num-3) | 0.158 |
| h(PTSD5_Score-1) | 0.020 |
| h(1-PTSD5_Score) | -0.058 |
| Variable | N Subsets | GCV | RSS |
|---|---|---|---|
| PTSD5_Score | 5 | 1 | 3 |
| Anxiety_Severity_num | 4 | 1 | 2 |
| Metric | Value |
|---|---|
| Selected Terms | 4.000 |
| R-squared | 0.014 |
| GRSq | 0.011 |
PTSD5_Scoreis the most influential predictor (baseline = 100).Anxiety_Severity_numis about 54%
                           [,1]
Cancer_Avoidance_Mean 0.1040759
Interactions appear as products (such as):
h(Anxiety_Severity_num-3) = 0.158: When anxiety severity score > 3, cancer avoidance increases by 0.158 units.
h(1-PTSD5_Score) = -0.058: When PTSD score < 1, cancer avoidance decreases by 0.058 units, meaning higher PTSD scores are associated with slightly higher avoidance.
Selected model at 5 terms
GRSq/RSq barely above zero (GRSq = 0.011, RSq = 0.014)
Mean out-of-fold RSq is negative - confirms no predictive power
CVRSq = -0.003, MaxErr = 2.35, This suggests health condition variables don’t explain Cancer_Avoidance_Mean very well.
Predictive power is weak: training R-square ~ 0.065, The model explains about 6.5% of the variance in Cancer_Avoidance_Mean on the training data and is a weak fit.
The correlation between Cancer_Avoidance_Mean and health condition is also very week (0.1040759)
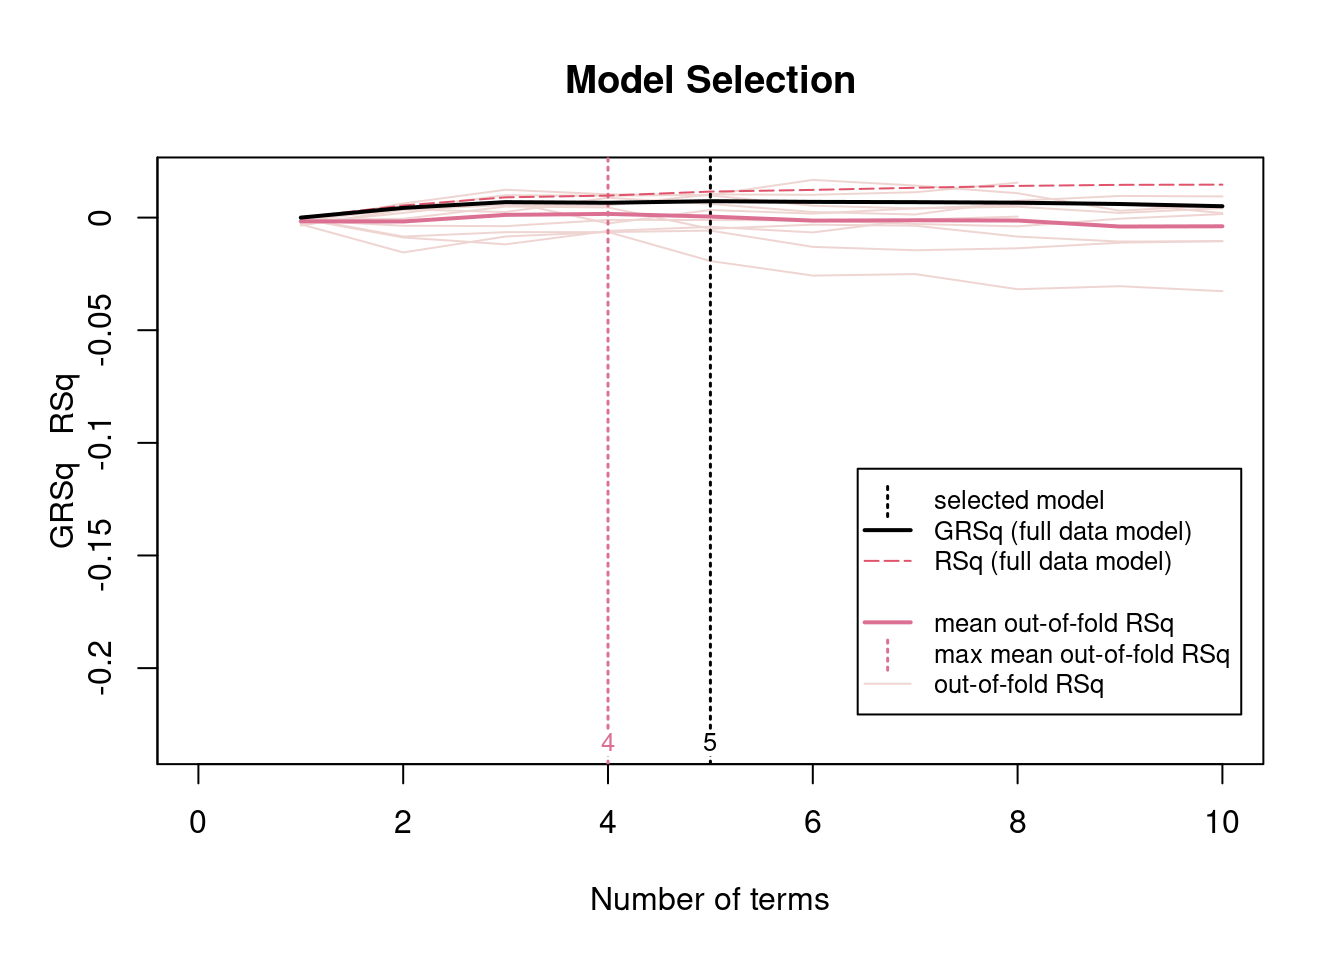
The model selection plot shows that both RSq (training fit) and GRSq (generalized R-square) initially increase, indicating that adding the first few hinge functions improves model performance. However, after approximately 4 terms, GRSq reaches its maximum and then slightly declines, suggesting that additional terms provide minimal benefit and may cause overfitting.
The selected model at 4 terms uses 4 predictors and achieves a modest GRSq (0.01), indicating that although weak nonlinear relationships exist, the overall predictive power of the model remains low.
CLASSIFICATION MODEL
(binary outcome Cancer_Avoiders01)
Random Forest
Demographic Model
| Metric | Value |
|---|---|
| accuracy | 0.961 |
| kap | 0.000 |
| Truth | 0 | 1 |
|---|---|---|
| 0 | 2334 | 94 |
| 1 | 0 | 0 |
| Metric | Value |
|---|---|
| ROC AUC | 0.424 |
High accuracy (0.961) simply reflects predicting majority class.
ROC AUC = 0.424 , which means no better than random
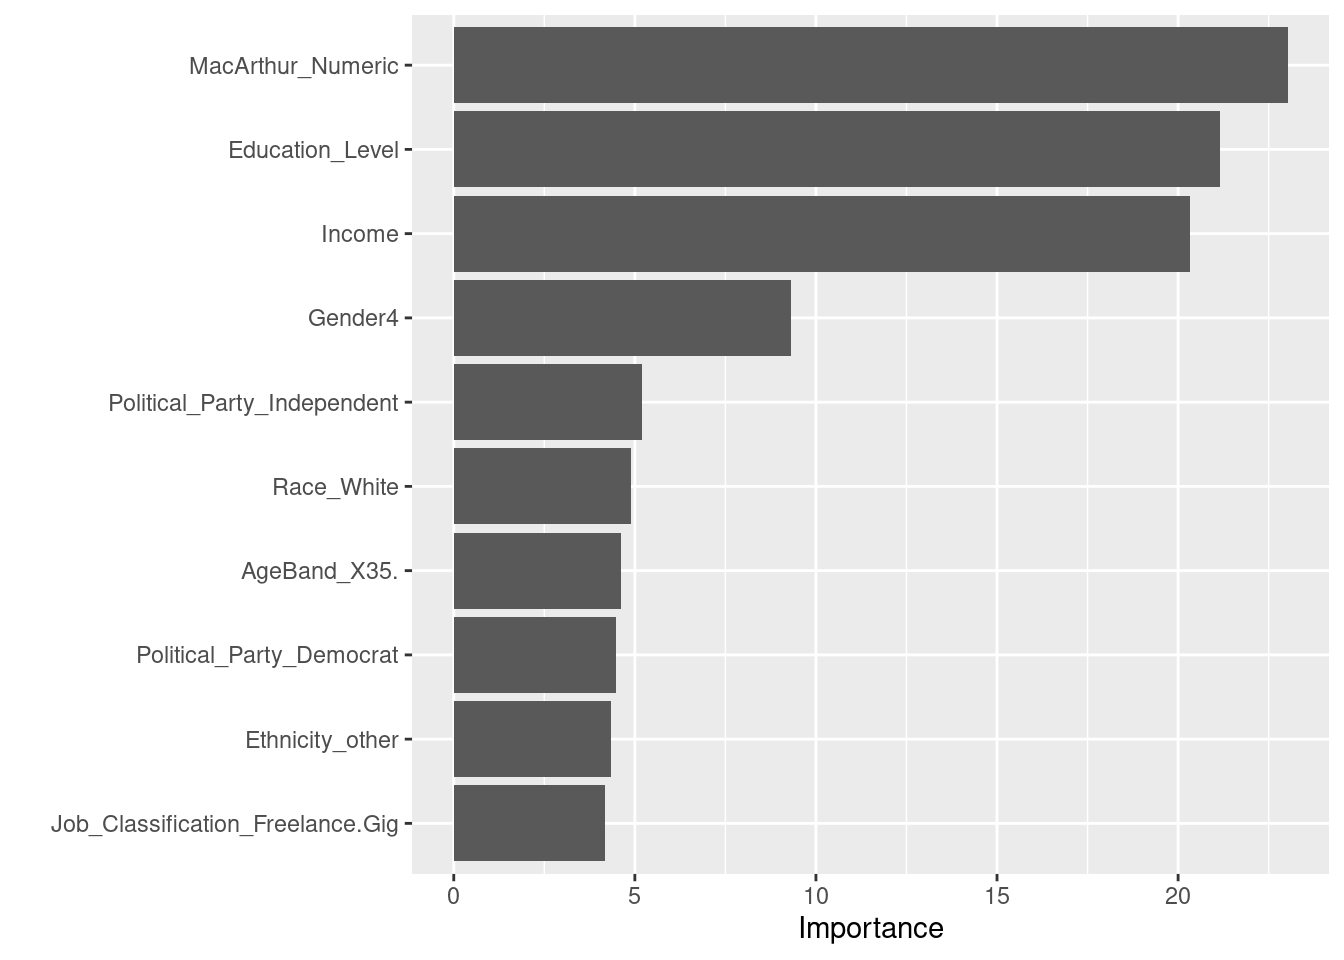
The random forest model shows that
MacArthur_Numericis the most predict variable.
| Estimate | Std. Error | z value | Pr(>|z|) | |
|---|---|---|---|---|
| (Intercept) | -2.607 | 0.161 | -16.153 | 0.000 |
| MacArthur_Numeric | -0.108 | 0.032 | -3.407 | 0.001 |
The logistic regression shows a statistically significant negative relationship between MacArthur scores and the probability of being a cancer avoider (\(\beta\) = -0.108, p = 0.0006). For each one-unit increase in the MacArthur score, the log-odds of being a cancer avoider decrease by 0.108, meaning individuals with higher subjective socioeconomic status are less likely to be classified as cancer avoiders.
However, the model shows minimal improvement with only 11.8 point reduction in deviance over the null model (null deviance = 2785.6, residual deviance = 2773.8).
Area under the curve: 0.5506- ROC AUC = 0.55, which means slightly better than random
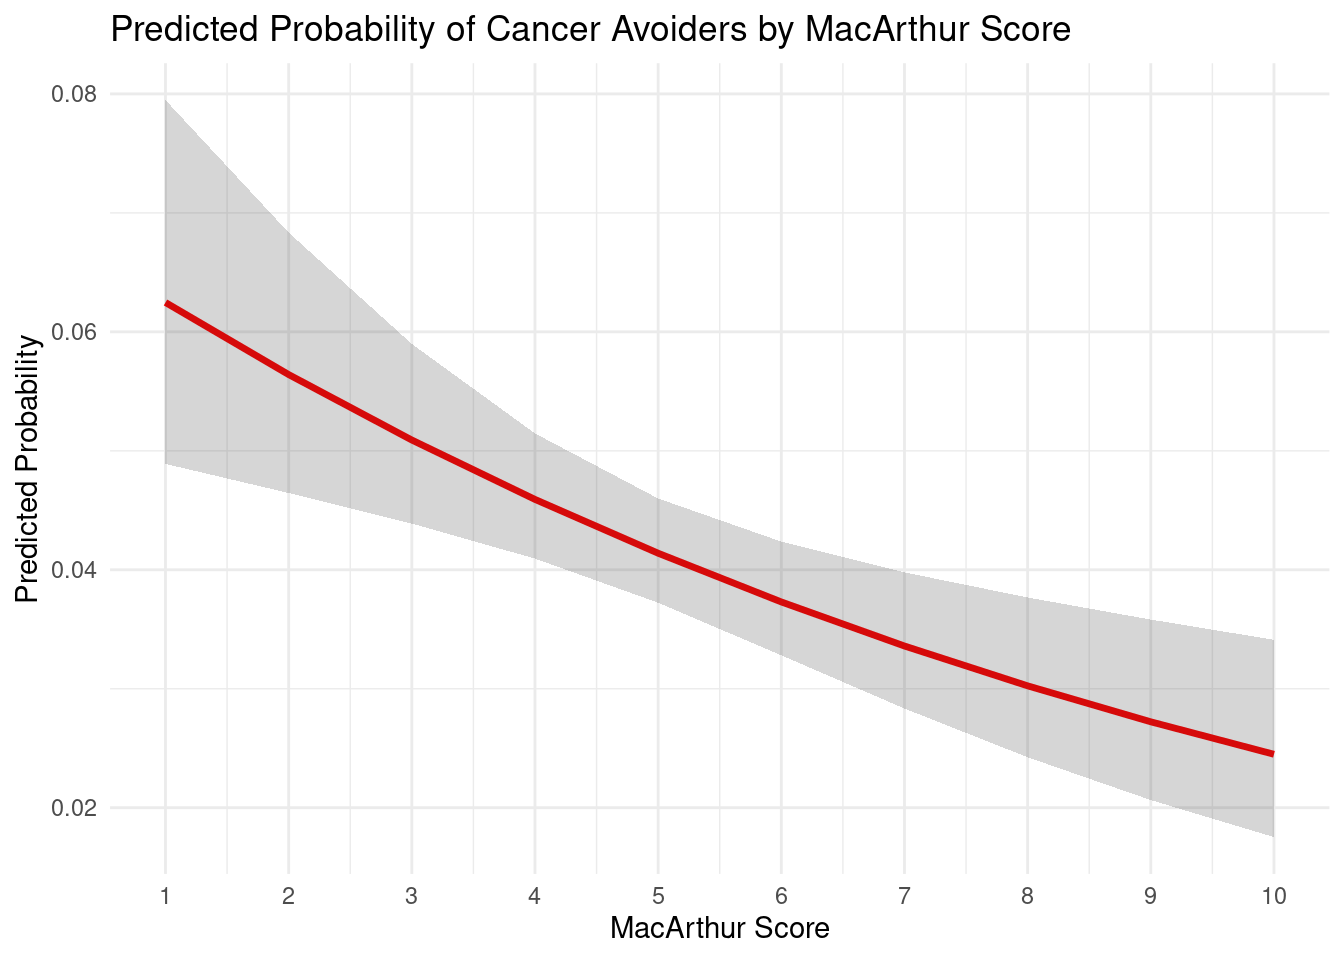
The plot displays the predicted probability of being a cancer avoider across MacArthur scores ranging from 1 to 10. The red line shows a clear downward trend. The gray confidence band widens slightly at the extremes but remains relatively narrow, indicating consistent uncertainty across the score range. This visualization confirms the negative relationship identified in the logistic regression, higher socioeconomic status is associated with lower probability of being a cancer avoider.
However, the poor ROC AUC value (0.424) indicates that although the relationship is statistically significant, the model has little practical use in identifying cancer avoiders.
Media Usage Model
| Metric | Value |
|---|---|
| accuracy | 0.949 |
| kap | 0.000 |
| Truth | 0 | 1 |
|---|---|---|
| 0 | 1950 | 104 |
| 1 | 0 | 0 |
| Metric | Value |
|---|---|
| ROC AUC | 0.495 |
High accuracy (0.949) simply reflects predicting majority class.
ROC AUC = 0.495 , which means no better than random
The random forest model shows that people who are not using AI
AI_Use_Nois the most predict variable.
| Estimate | Std. Error | z value | Pr(>|z|) | |
|---|---|---|---|---|
| (Intercept) | -2.933 | 0.061 | -48.001 | 0.000 |
| AI_UseNo | -0.255 | 0.157 | -1.631 | 0.103 |
- The logistic regression shows a none statistically significant relationship between AI usage and the probability of being a cancer avoider (\(\beta\) = -0.255, p = 0.103).
Area under the curve: 0.5178- ROC AUC = 0.51, which means slightly better than random
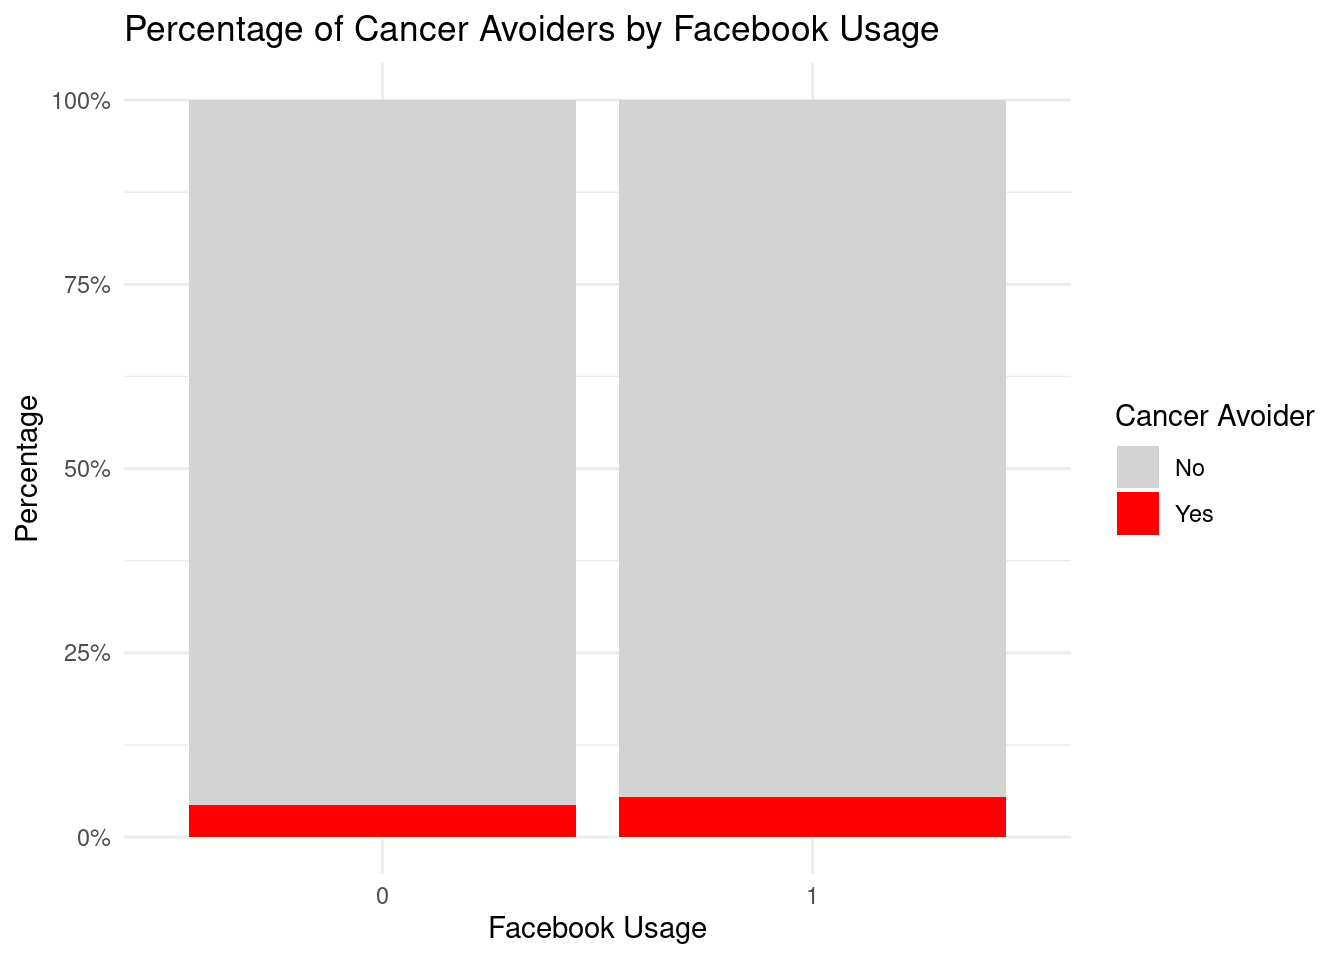
- The stacked bar chart displays the percentage distribution of cancer avoiders and non-avoiders across AI usage groups (0 = No, 1 = Yes). Both groups show similar distributions, with cancer avoiders (red) representing a very small percentage at the bottom of each bar. The visual similarity between the two bars reinforces that this difference has minimal value for predicting cancer avoider status.
Health Condition Model
| Metric | Value |
|---|---|
| accuracy | 0.952 |
| kap | 0.000 |
| Truth | 0 | 1 |
|---|---|---|
| 0 | 1913 | 97 |
| 1 | 0 | 0 |
| Metric | Value |
|---|---|
| ROC AUC | 0.478 |
High accuracy (0.952) simply reflects predicting majority class.
ROC AUC = 0.478, which means no better than random
The random forest model shows that
Stress_TotalScoreis the most predict variable.
| Estimate | Std. Error | z value | Pr(>|z|) | |
|---|---|---|---|---|
| (Intercept) | -3.021 | 0.099 | -30.460 | 0.00 |
| Stress_TotalScore | 0.017 | 0.019 | 0.878 | 0.38 |
- The logistic regression shows a none significant relationship between stress total score and the probability of being a cancer avoider (\(\beta\) = 0.017, p = 0.38).
Area under the curve: 0.5142- ROC AUC = 0.51, which means slightly better than random

- The plot displays the predicted probability of being a cancer avoider across stress total scores ranging from 1 to 18. The red line shows a very slight upward trend. The gray confidence band widens at higher stress scores, indicating increasing uncertainty in predictions for individuals with very high stress levels. Which demonstrates that stress total score provides essentially no predictive information for identifying cancer avoiders, consistent with the lack of statistical significance in the model.
Health Behavior Model
| Metric | Value |
|---|---|
| accuracy | 0.954 |
| kap | 0.000 |
| Truth | 0 | 1 |
|---|---|---|
| 0 | 1998 | 96 |
| 1 | 0 | 0 |
| Metric | Value |
|---|---|
| ROC AUC | 0.484 |
High accuracy (0.954) simply reflects predicting majority class.
ROC AUC = 0.484, which means no better than random
The random forest model shows that
Cigarette_Smokingis the most predict variable.
| Estimate | Std. Error | z value | Pr(>|z|) | |
|---|---|---|---|---|
| (Intercept) | -3.0998420 | 0.06439758 | -48.13600 | 0.00e+00 |
| Cigarette_Smoking_num1 | 0.6244502 | 0.12832267 | 4.86625 | 1.14e-06 |
The logistic regression shows a statistically significant positive relationship between smokers and the probability of being a cancer avoider (\(\beta\) = 0.6244502, p = 1.14e-06). Smokers have odds of being a cancer avoider that are 1.87 times higher (\(e^0.6244502\) = 1.867) compared to non-smokers, representing an 86.7% increase in odds
However, the model shows modest improvement over the null model, with a 21.7 point reduction in deviance (null deviance = 2709.8, residual deviance = 2688.1), indicating that smokers explains modest of the variation in cancer avoider.
Area under the curve: 0.5506- ROC AUC = 0.55, which means slightly better than random
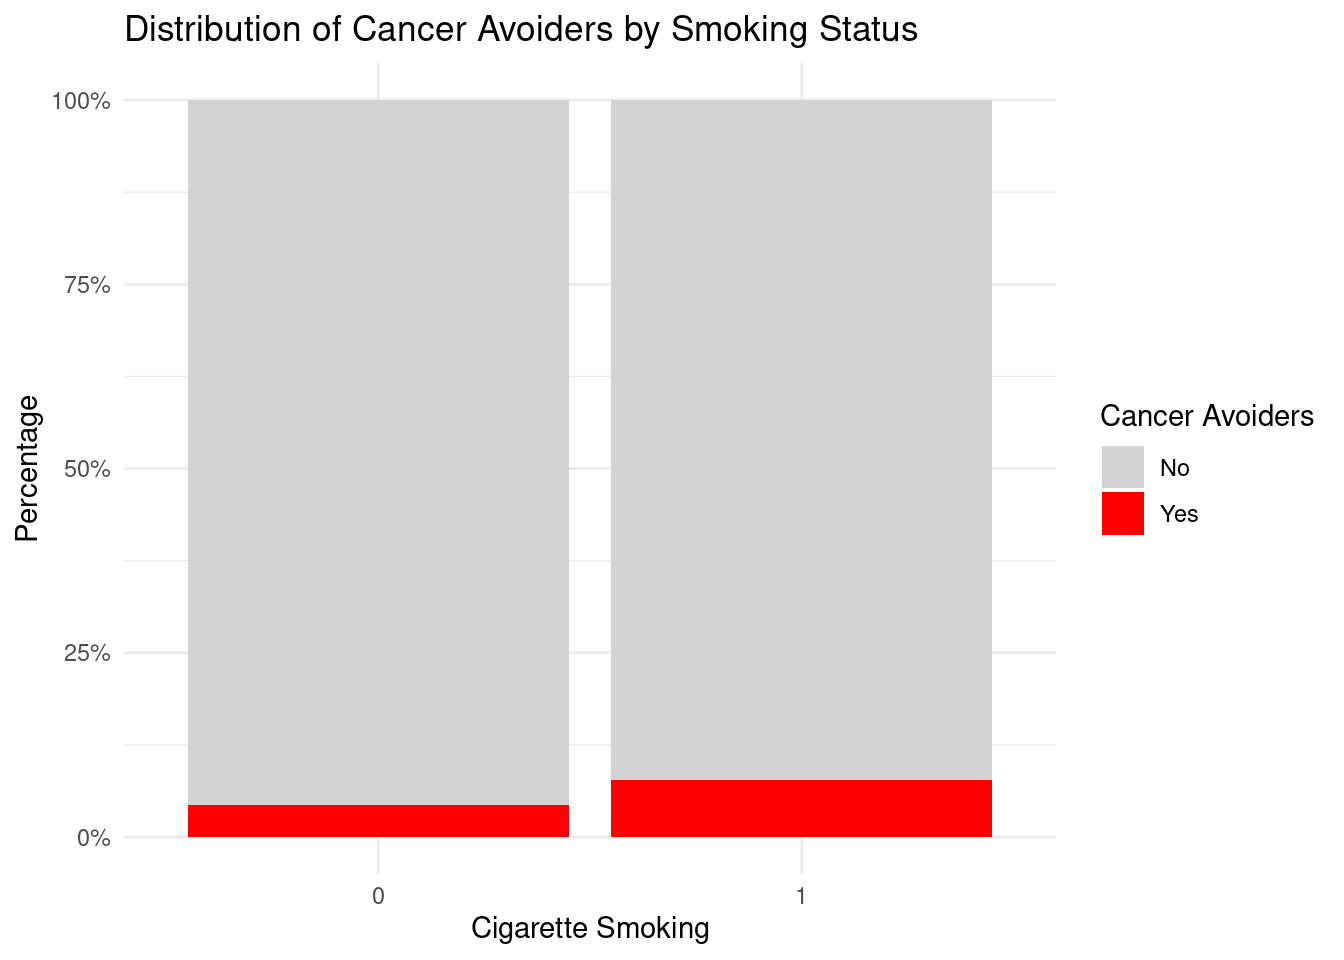
The stacked bar chart displays the percentage distribution of cancer avoiders and non-avoiders across smoking status (0 = Non-smoker, 1 = Smoker). Smokers display a larger red segment at approximately 8-9% cancer avoiders. This visual pattern confirms the logistic regression finding, smokers are roughly twice as likely to be cancer avoiders compared to non-smokers.
However, it’s important to note that despite this significant association, cancer avoiders remain a minority in both groups, with over 90% of both smokers and non-smokers classified as non-avoiders.
Other Model
| Metric | Value |
|---|---|
| accuracy | 0.959 |
| kap | 0.000 |
| Truth | 0 | 1 |
|---|---|---|
| 0 | 2112 | 91 |
| 1 | 0 | 0 |
| Metric | Value |
|---|---|
| ROC AUC | 0.474 |
High accuracy (0.96) simply reflects predicting majority class.
ROC AUC = 0.474, which means no better than random
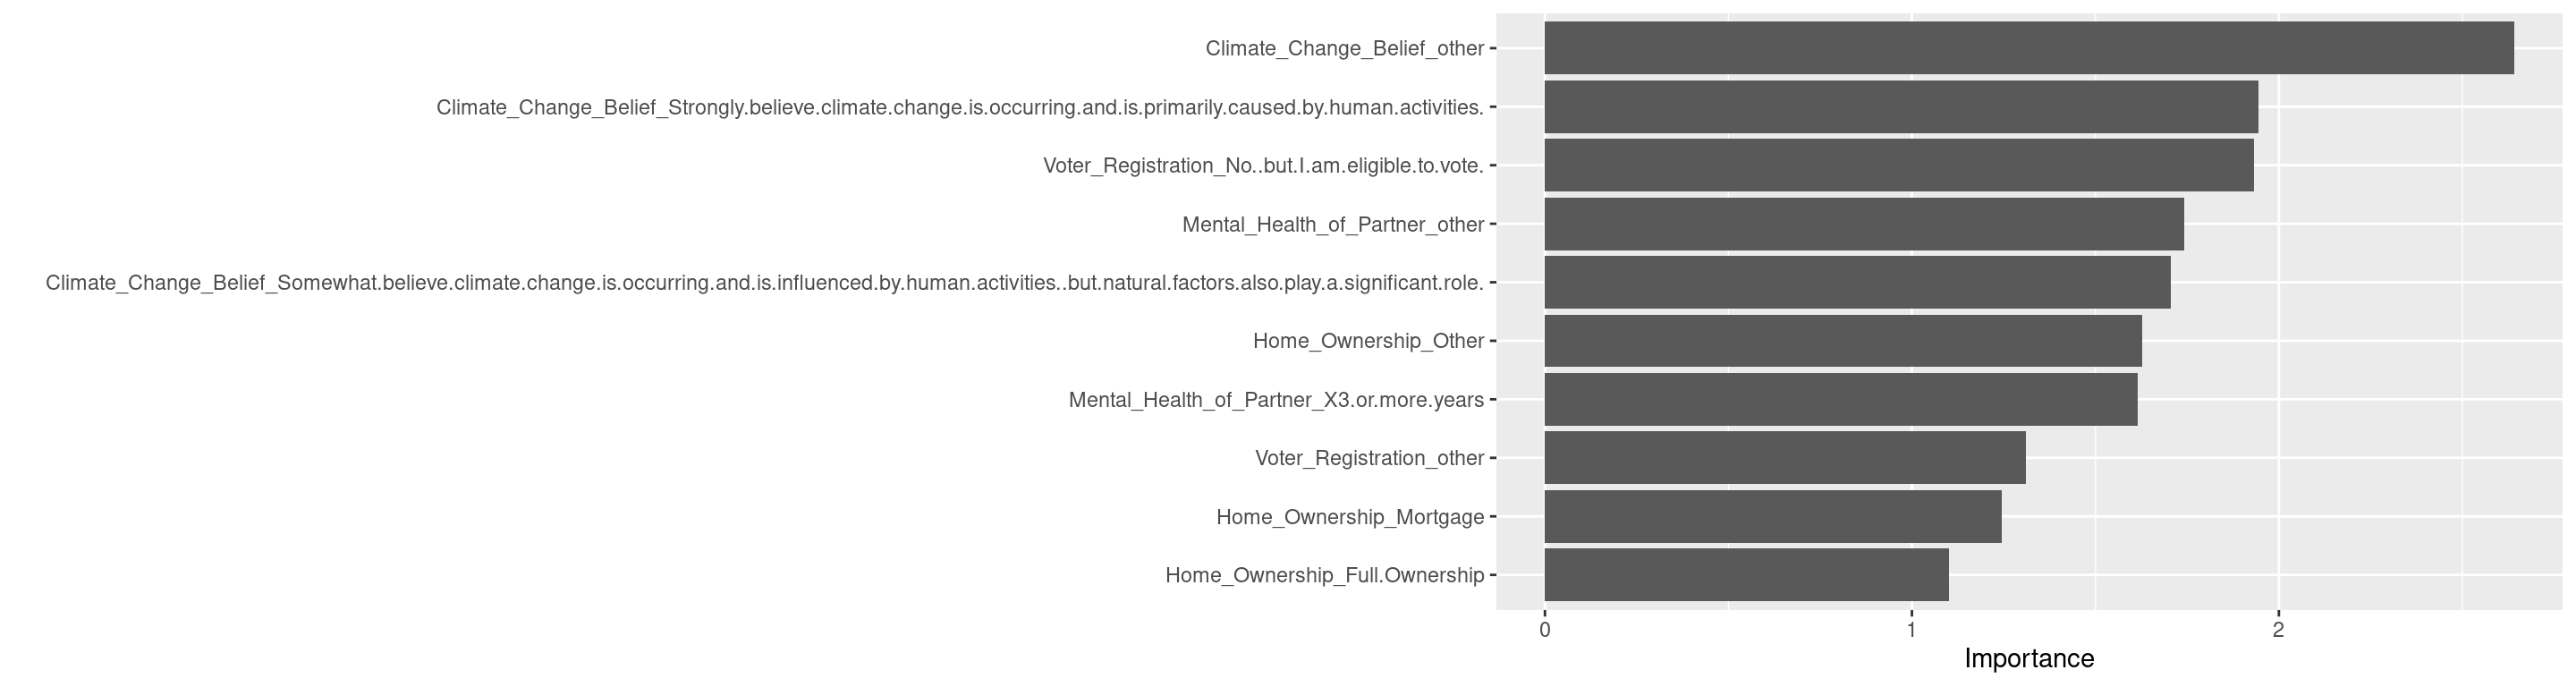
The random forest model shows that
Climate_Change_Belief(other) is the most predict variable.
| Estimate | Std. Error | z value | Pr(>|z|) | |
|---|---|---|---|---|
| (Intercept) | -2.0238717 | 0.1749241 | -11.5699964 | 0.0000000000 |
| Climate_Change_BeliefSomewhat skeptical about the impact of human activities on climate change, believing that climate change is a natural cycle. | -0.4822372 | 0.2479937 | -1.9445539 | 0.0518286892 |
| Climate_Change_BeliefUncertain about the causes and extent of climate change. | -0.6868416 | 0.2706622 | -2.5376340 | 0.0111604622 |
| Climate_Change_BeliefNo opinion on the matter. | -0.1903024 | 0.3404774 | -0.5589282 | 0.5762107289 |
| Climate_Change_BeliefSomewhat believe climate change is occurring and is influenced by human activities, but natural factors also play a significant role. | -1.0713418 | 0.2064292 | -5.1898761 | 0.0000002104 |
| Climate_Change_BeliefStrongly believe climate change is occurring and is primarily caused by human activities. | -1.2331918 | 0.1938253 | -6.3623870 | 0.0000000002 |
The logistic regression shows significant negative associations between accepting human caused climate change and the probability of being a cancer avoider. Individuals who strongly believe climate change is primarily caused by human activities have 71% lower odds (1 - \(e^-1.233\) = 0.71) of being cancer avoiders (\(\beta\) = -1.233, p = 1.87e-10) compared to climate dennier.
The model shows modest improvement over the null model with a 50.1 point deviance reduction (null deviance = 2781.4, residual deviance = 2731.3)
Area under the curve: 0.5873- ROC AUC = 0.58, which means slightly better than random
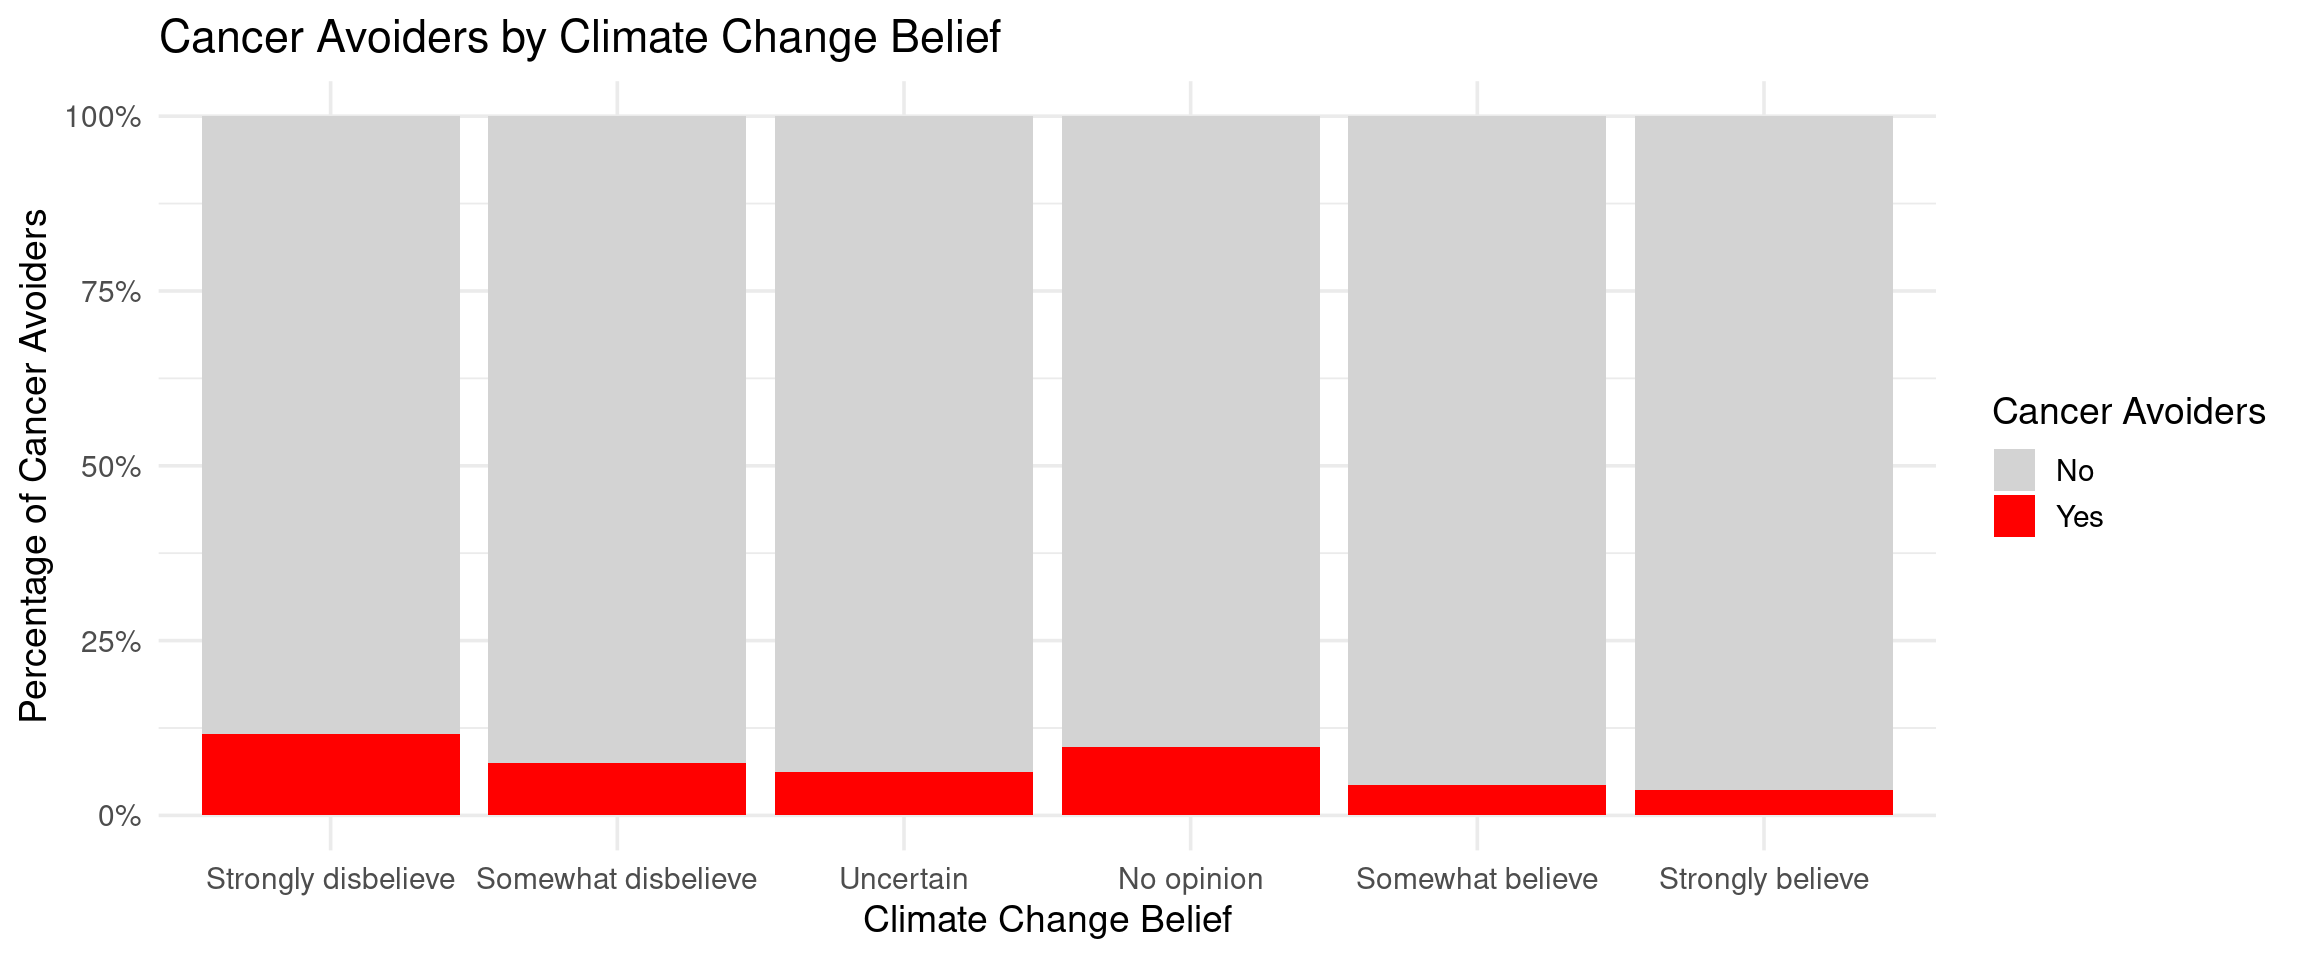
- The stacked bar chart displays the percentage distribution of cancer avoiders across six climate change belief categories. This visual pattern demonstrates that individuals who deny about human-caused climate change are 3-4 times more likely to be cancer avoiders compared to those who strongly accept about human-caused climate change.
Comprehensive Model with All Predictors

| Metric | Value |
|---|---|
| RMSE | 0.620 |
| MAE | 0.515 |
| R-squared | 0.086 |
| Correlation | 0.293 |
RMSE (~0.62) and MAE (~0.52) are pretty close, meaning errors aren’t heavily dominated by outliers.
Correlation = 0.3 is low. But it imporve a little bit compare to all the regression models. It basically means that predicted values do not track the actual values at all. So the model is not capturing the pattern in the test data.
If predictors have very weak relationships with the outcome, the model will predicts values near the mean of the training set.
The random forest model shows that
Stress_TotalScoreis the most predict variable.

| Metric | Estimate |
|---|---|
| accuracy | 0.952 |
| kap | 0.000 |
| ROC AUC | 0.228 |
High accuracy (0.95) simply reflects predicting majority class.
ROC AUC = 0.23, which means no better than random, and is worse than all the classification models.
The random forest model shows that
Stress_TotalScoreis the most predict variable.
Discussion
This analysis examined predictors of cancer avoidance scores across demographic, media-related, health, behavioral, and other domains using regression, classification, and MARS models. Across all approaches, the findings point to the same conclusion is that many predictors reached significance, but none meaningfully predicted cancer avoidance.
Regression models explained less than 3% of variance (\(R^2\) < 0.03), and the full model reached only a modest correlation of 0.30. Classification models showed high accuracy due to class imbalance, but poor distinction, with ROC AUC values between 0.23 and 0.49, at below chance. The full classification model performed worst (AUC = 0.23), reinforcing that adding strong predictors does not improve performance.
MARS models found some nonlinear patterns, but the negative cross-validated \(R^2\) shows they likely don’t hold up and reflect overfitting. Overall, the small predictive value suggests important factors are missing. The low number of cancer avoiders (4–5%) also makes prediction harder. The unexpected links with smoking and climate beliefs may come from unmeasured factors or differences in how people understand cancer avoidance.
Limitations
Cross-sectional design: Because the data were collected at one point in time, we cannot tell what causes what. Other unmeasured factors may also affect the results.
Self-reported outcome: People may interpret “cancer avoidance” differently, which means the score may not fully reflect their real behaviors.
Small effect sizes: Many predictors were statistically significant but had tiny effects, likely because the sample size was large.
Inconsistent samples across models: Missing data led to different subsets being used, limiting direct comparisons.
Random forest issues: The variable importance results were not consistent with simpler models and may exaggerate weak patterns.
Limited generalizability: Results may not generalize to other groups or contexts.
Future Directions
Future studies should: (1) use longitudinal data to better understand cause-and-effect; (2) explore factors that might explain or change the relationships found; (3) oversample cancer avoiders to address class imbalance; (4) include qualitative work to understand unexpected patterns; and (5) validate these findings in independent samples.
Acknowledgments
We thank the following people and organizations for their guidance, support, and resources in this project:
- Dr. Shane McCarty (Binghamton University) – Principal Investigator and mentor
- Dr. Heather Orom (University at Buffalo) – Principal Investigator and mentor
- Dr. Kargin Vladislav (Binghamton University) – Principal Investigator and mentor
- Cloud Research – Owner of the Health Avoiders dataset and provider of access to de-identified survey data
Appendix A: Detailed Statistical Output
Linear Regression
MacArthur Scale vs cancer-avoidance score
Show the code
MacArthur_cancer_linear <- lm(Cancer_Avoidance_Mean ~ MacArthur_Numeric, data = demo_data)
summary(MacArthur_cancer_linear)
Call:
lm(formula = Cancer_Avoidance_Mean ~ MacArthur_Numeric, data = demo_data)

Residuals:
     Min       1Q   Median       3Q      Max
-0.83427 -0.58252 -0.08252  0.44283  2.34318

Coefficients:
                   Estimate Std. Error t value Pr(>|t|)
(Intercept)        1.859624   0.021487  86.548  < 2e-16 ***
MacArthur_Numeric -0.025350   0.003984  -6.362 2.09e-10 ***
---
Signif. codes:  0 '***' 0.001 '**' 0.01 '*' 0.05 '.' 0.1 ' ' 1

Residual standard error: 0.6307 on 8091 degrees of freedom
Multiple R-squared:  0.004978,  Adjusted R-squared:  0.004855
F-statistic: 40.48 on 1 and 8091 DF,  p-value: 2.094e-10
Age vs cancer-avoidance score
Show the code
agegroup_cancer_linear <- lm(Cancer_Avoidance_Mean ~ AgeGroup, data = demo_data)
summary(age_cancer_linear)
Call:
lm(formula = Cancer_Avoidance_Mean ~ AgeBand, data = demo_data)

Residuals:
    Min      1Q  Median      3Q     Max
-0.7608 -0.5721 -0.0721  0.4279  2.3029

Coefficients:
            Estimate Std. Error t value Pr(>|t|)
(Intercept)  1.69710    0.01016 166.958  < 2e-16 ***
AgeBand35+   0.06364    0.01405   4.529 6.02e-06 ***
---
Signif. codes:  0 '***' 0.001 '**' 0.01 '*' 0.05 '.' 0.1 ' ' 1

Residual standard error: 0.6314 on 8091 degrees of freedom
Multiple R-squared:  0.002528,  Adjusted R-squared:  0.002405
F-statistic: 20.51 on 1 and 8091 DF,  p-value: 6.022e-06
Age vs cancer-avoidance score
Show the code
ageband_cancer_linear <- lm(Cancer_Avoidance_Mean ~ AgeBand, data = demo_data)
summary(age_cancer_linear)
Call:
lm(formula = Cancer_Avoidance_Mean ~ AgeBand, data = demo_data)

Residuals:
    Min      1Q  Median      3Q     Max
-0.7608 -0.5721 -0.0721  0.4279  2.3029

Coefficients:
            Estimate Std. Error t value Pr(>|t|)
(Intercept)  1.69710    0.01016 166.958  < 2e-16 ***
AgeBand35+   0.06364    0.01405   4.529 6.02e-06 ***
---
Signif. codes:  0 '***' 0.001 '**' 0.01 '*' 0.05 '.' 0.1 ' ' 1

Residual standard error: 0.6314 on 8091 degrees of freedom
Multiple R-squared:  0.002528,  Adjusted R-squared:  0.002405
F-statistic: 20.51 on 1 and 8091 DF,  p-value: 6.022e-06
Age over 35 vs cancer-avoidance score
Show the code
model_over35 <- lm(Cancer_Avoidance_Mean ~ Education_Level + Income +
                   MacArthur_Numeric + Political_Party,
                   data = dplyr::filter(demo_data, AgeBand == "35+"))

summary(model_over35)
Call:
lm(formula = Cancer_Avoidance_Mean ~ Education_Level + Income +
    MacArthur_Numeric + Political_Party, data = dplyr::filter(demo_data,
    AgeBand == "35+"))

Residuals:
     Min       1Q   Median       3Q      Max
-1.09262 -0.59425 -0.05984  0.45032  2.45083

Coefficients:
                                  Estimate Std. Error t value Pr(>|t|)
(Intercept)                       2.160298   0.044233  48.839  < 2e-16 ***
Education_Level                  -0.011298   0.008378  -1.349 0.177554
Income                           -0.015754   0.006892  -2.286 0.022306 *
MacArthur_Numeric                -0.029331   0.006519  -4.499 7.00e-06 ***
Political_PartyDemocrat          -0.225468   0.028414  -7.935 2.67e-15 ***
Political_PartyIndependent       -0.131147   0.030024  -4.368 1.28e-05 ***
Political_PartySomething else    -0.138479   0.040765  -3.397 0.000688 ***
Political_PartyPrefer not to say -0.093357   0.057189  -1.632 0.102659
---
Signif. codes:  0 '***' 0.001 '**' 0.01 '*' 0.05 '.' 0.1 ' ' 1

Residual standard error: 0.6599 on 4226 degrees of freedom
Multiple R-squared:  0.02841,   Adjusted R-squared:  0.0268
F-statistic: 17.65 on 7 and 4226 DF,  p-value: < 2.2e-16
Influencer Following vs cancer-avoidance score
Show the code
influencer_cancer_linear <- lm(Cancer_Avoidance_Mean ~ Influencer_Following, data = media_data)
summary(influencer_cancer_linear)
Call:
lm(formula = Cancer_Avoidance_Mean ~ Influencer_Following, data = media_data)

Residuals:
    Min      1Q  Median      3Q     Max
-0.7519 -0.6153 -0.1153  0.3847  2.2597

Coefficients:
                           Estimate Std. Error t value Pr(>|t|)
(Intercept)                 1.75190    0.02044  85.723   <2e-16 ***
Influencer_FollowingUnsure -0.04183    0.05730  -0.730    0.465
Influencer_FollowingYes    -0.01157    0.02213  -0.523    0.601
---
Signif. codes:  0 '***' 0.001 '**' 0.01 '*' 0.05 '.' 0.1 ' ' 1

Residual standard error: 0.6424 on 6841 degrees of freedom
Multiple R-squared:  9.096e-05, Adjusted R-squared:  -0.0002014
F-statistic: 0.3112 on 2 and 6841 DF,  p-value: 0.7326
Stress Score vs cancer-avoidance score
Show the code
stress_cancer_linear <- lm(Cancer_Avoidance_Mean ~ Stress_TotalScore, data = health_condition_data)
summary(stress_cancer_linear)
Call:
lm(formula = Cancer_Avoidance_Mean ~ Stress_TotalScore, data = health_condition_data)

Residuals:
    Min      1Q  Median      3Q     Max
-0.8231 -0.6168 -0.1114  0.4594  2.2690

Coefficients:
                  Estimate Std. Error t value Pr(>|t|)
(Intercept)       1.725590   0.014186 121.639   <2e-16 ***
Stress_TotalScore 0.005418   0.002839   1.908   0.0564 .
---
Signif. codes:  0 '***' 0.001 '**' 0.01 '*' 0.05 '.' 0.1 ' ' 1

Residual standard error: 0.6557 on 6695 degrees of freedom
Multiple R-squared:  0.0005436, Adjusted R-squared:  0.0003943
F-statistic: 3.641 on 1 and 6695 DF,  p-value: 0.05641
Smoking vs cancer-avoidance score
Show the code
smoking_cancer_linear <- lm(Cancer_Avoidance_Mean ~ Cigarette_Smoking_num, data = health_behavior_data)
summary(smoking_cancer_linear)
Call:
lm(formula = Cancer_Avoidance_Mean ~ Cigarette_Smoking_num, data = health_behavior_data)

Residuals:
     Min       1Q   Median       3Q      Max
-0.89396 -0.58362 -0.08362  0.41638  2.29138

Coefficients:
                       Estimate Std. Error t value Pr(>|t|)
(Intercept)             1.70862    0.00845 202.209   <2e-16 ***
Cigarette_Smoking_num1  0.18534    0.02096   8.842   <2e-16 ***
---
Signif. codes:  0 '***' 0.001 '**' 0.01 '*' 0.05 '.' 0.1 ' ' 1

Residual standard error: 0.646 on 6977 degrees of freedom
Multiple R-squared:  0.01108,   Adjusted R-squared:  0.01094
F-statistic: 78.18 on 1 and 6977 DF,  p-value: < 2.2e-16
Climate Change Belief vs cancer-avoidance score
Show the code
voter_cancer_linear <- lm(Cancer_Avoidance_Mean ~ Climate_Change_Belief, data = other_data)
summary(voter_cancer_linear)
Call:
lm(formula = Cancer_Avoidance_Mean ~ Climate_Change_Belief, data = other_data)

Residuals:
    Min      1Q  Median      3Q     Max
-0.9943 -0.5499 -0.0499  0.4501  2.3479

Coefficients:
                                                                                                                                                           Estimate
(Intercept)                                                                                                                                                 1.92232
Climate_Change_BeliefSomewhat skeptical about the impact of human activities on climate change, believing that climate change is a natural cycle.          -0.02146
Climate_Change_BeliefUncertain about the causes and extent of climate change.                                                                              -0.06197
Climate_Change_BeliefNo opinion on the matter.                                                                                                              0.07200
Climate_Change_BeliefSomewhat believe climate change is occurring and is influenced by human activities, but natural factors also play a significant role. -0.12242
Climate_Change_BeliefStrongly believe climate change is occurring and is primarily caused by human activities.                                             -0.27026
                                                                                                                                                           Std. Error
(Intercept)                                                                                                                                                   0.03573
Climate_Change_BeliefSomewhat skeptical about the impact of human activities on climate change, believing that climate change is a natural cycle.             0.04635
Climate_Change_BeliefUncertain about the causes and extent of climate change.                                                                                 0.04781
Climate_Change_BeliefNo opinion on the matter.                                                                                                                0.06589
Climate_Change_BeliefSomewhat believe climate change is occurring and is influenced by human activities, but natural factors also play a significant role.    0.03844
Climate_Change_BeliefStrongly believe climate change is occurring and is primarily caused by human activities.                                                0.03711
                                                                                                                                                           t value
(Intercept)                                                                                                                                                 53.804
Climate_Change_BeliefSomewhat skeptical about the impact of human activities on climate change, believing that climate change is a natural cycle.           -0.463
Climate_Change_BeliefUncertain about the causes and extent of climate change.                                                                               -1.296
Climate_Change_BeliefNo opinion on the matter.                                                                                                               1.093
Climate_Change_BeliefSomewhat believe climate change is occurring and is influenced by human activities, but natural factors also play a significant role.  -3.184
Climate_Change_BeliefStrongly believe climate change is occurring and is primarily caused by human activities.                                              -7.283
                                                                                                                                                           Pr(>|t|)
(Intercept)                                                                                                                                                 < 2e-16
Climate_Change_BeliefSomewhat skeptical about the impact of human activities on climate change, believing that climate change is a natural cycle.           0.64346
Climate_Change_BeliefUncertain about the causes and extent of climate change.                                                                               0.19494
Climate_Change_BeliefNo opinion on the matter.                                                                                                              0.27458
Climate_Change_BeliefSomewhat believe climate change is occurring and is influenced by human activities, but natural factors also play a significant role.  0.00146
Climate_Change_BeliefStrongly believe climate change is occurring and is primarily caused by human activities.                                             3.62e-13

(Intercept)                                                                                                                                                ***
Climate_Change_BeliefSomewhat skeptical about the impact of human activities on climate change, believing that climate change is a natural cycle.
Climate_Change_BeliefUncertain about the causes and extent of climate change.
Climate_Change_BeliefNo opinion on the matter.
Climate_Change_BeliefSomewhat believe climate change is occurring and is influenced by human activities, but natural factors also play a significant role. **
Climate_Change_BeliefStrongly believe climate change is occurring and is primarily caused by human activities.                                             ***
---
Signif. codes:  0 '***' 0.001 '**' 0.01 '*' 0.05 '.' 0.1 ' ' 1

Residual standard error: 0.6361 on 7336 degrees of freedom
Multiple R-squared:  0.02468,   Adjusted R-squared:  0.02402
F-statistic: 37.13 on 5 and 7336 DF,  p-value: < 2.2e-16
Mars
Demographic model
Call: earth(formula=Cancer_Avoidance_Mean~Ethnicity+Political_Party+Ge...),
            data=train)

                                 coefficients
(Intercept)                        1.75720384
Political_PartyDemocrat           -0.19328714
Political_PartyIndependent        -0.12161712
Political_PartySomething else     -0.12329667
Political_PartyPrefer not to say  -0.12747078
Job_ClassificationBlue Collar      0.12417709
Job_ClassificationProfessional    -0.08218705
RaceWhite                          0.06420844
h(3-Gender4)                       0.03543435
h(57-Age)                         -0.00197177
h(Age-57)                         -0.01456616
h(8-MacArthur_Numeric)             0.02300003

Selected 12 of 14 terms, and 10 of 37 predictors
Termination condition: RSq changed by less than 0.001 at 14 terms
Importance: Political_PartyDemocrat, MacArthur_Numeric, RaceWhite, ...
Number of terms at each degree of interaction: 1 11 (additive model)
GCV 0.394542    RSS 2216.969    GRSq 0.01842962    RSq 0.02604001
nsubsets gcv rss
Political_PartyDemocrat 11 100.0 100.0
MacArthur_Numeric 10 79.0 84.1
RaceWhite 9 64.4 73.0
Job_ClassificationProfessional 8 53.8 64.6
Political_PartyIndependent 7 48.5 59.3
Political_PartySomething else 6 44.1 54.5
Political_PartyPrefer not to say 4 32.9 42.7
Age 4 32.7 42.6
Gender4 2 20.0 28.5
Job_ClassificationBlue Collar 2 20.0 28.5Cross validation demographic
Show the code
library(earth)

mars_model <- earth(
  Cancer_Avoidance_Mean ~ Ethnicity + Political_Party + Gender4 + Job_Classification +
    Education_Level + Age + Income + Race + MacArthur_Numeric,
  data = train,
  degree = 2,       # allow up to 2-way interactions
  nfold = 10,       # 10-fold CV
  keepxy = TRUE
)
summary(mars_model)
Call: earth(formula=Cancer_Avoidance_Mean~Ethnicity+Political_Party+Ge...),
data=train, keepxy=TRUE, degree=2, nfold=10)
coefficients
(Intercept) 1.65055838
Political_PartyDemocrat -0.18513071
RaceWhite 0.16165369
h(Age-57) -0.01619991
h(8-MacArthur_Numeric) 0.05463350
Job_ClassificationUnemployed/Student/Parent * RaceWhite -0.08450903
EthnicityNo, not of Hispanic, Latino, or Spanish origin * h(57-Age) 0.00321065
Political_PartyIndependent * h(57-Age) -0.00546460
Political_PartySomething else * h(57-Age) -0.00536740
Political_PartyPrefer not to say * h(57-Age) -0.00514048
Job_ClassificationBlue Collar * h(57-Age) 0.00671600
Job_ClassificationProfessional * h(57-Age) -0.00386473
h(57-Age) * RaceAn ethnicity not listed here 0.00598310
h(Income-2) * RaceWhite -0.04184648
h(3-Gender4) * h(8-MacArthur_Numeric) 0.01071168
h(1-Education_Level) * h(57-Age) 0.04880712
h(Education_Level-3) * h(MacArthur_Numeric-8) 0.05571084
h(57-Age) * h(Income-2) 0.00110472
h(68-Age) * h(8-MacArthur_Numeric) -0.00153132
Selected 19 of 27 terms, and 15 of 37 predictors
Termination condition: RSq changed by less than 0.001 at 27 terms
Importance: Political_PartyDemocrat, MacArthur_Numeric, Age, RaceWhite, ...
Number of terms at each degree of interaction: 1 4 14
GCV 0.3911353 RSS 2179.943 GRSq 0.02690521 RSq 0.0423061 CVRSq 0.01286663
Note: the cross-validation sd's below are standard deviations across folds
Cross validation: nterms 18.60 sd 1.51 nvars 13.50 sd 1.90
CVRSq sd MaxErr sd
0.013 0.017 2.53 0.161Show the code
summary(mars_model) %>% .$coefficients %>% head(10) Cancer_Avoidance_Mean
(Intercept) 1.650558383
Political_PartyDemocrat -0.185130708
h(8-MacArthur_Numeric) 0.054633496
h(Age-57) -0.016199907
h(68-Age)*h(8-MacArthur_Numeric) -0.001531323
RaceWhite 0.161653689
Political_PartyIndependent*h(57-Age) -0.005464604
Job_ClassificationBlue Collar*h(57-Age) 0.006716000
Political_PartySomething else*h(57-Age) -0.005367400
h(Income-2)*RaceWhite -0.041846484Health condition Model
Show the code
# need to drop NA to get accuracy
health_condition_data <- selectdata %>%
  drop_na(
    Cancer_Avoidance_Mean, Stressful_Events_Recent, Current_Depression, Anxiety_Severity_num, PTSD5_Score,
    Health_Depression_Severity_num, Stress_TotalScore
  )

# split into training and testing sets
set.seed(123)
train_idx <- sample(seq_len(nrow(health_condition_data)), size = 0.7 * nrow(health_condition_data))
train <- health_condition_data[train_idx, ]
test  <- health_condition_data[-train_idx, ]

# Fit MARS model
mars_model_health_condition <- earth(
    Cancer_Avoidance_Mean ~ Stressful_Events_Recent + Current_Depression + Anxiety_Severity_num +
    PTSD5_Score +  Health_Depression_Severity_num + Stress_TotalScore,
  data = train
)

# Predict on test set
pred <- predict(mars_model_health_condition, newdata = test)

summary(mars_model_health_condition)
Call: earth(formula=Cancer_Avoidance_Mean~Stressful_Events_Recent+Curr...),
data=train)
coefficients
(Intercept) 1.72038110
h(Anxiety_Severity_num-3) 0.15842920
h(1-PTSD5_Score) -0.05777183
h(PTSD5_Score-1) 0.01978740
Selected 4 of 5 terms, and 2 of 7 predictors
Termination condition: RSq changed by less than 0.001 at 5 terms
Importance: PTSD5_Score, Anxiety_Severity_num, ...
Number of terms at each degree of interaction: 1 3 (additive model)
GCV 0.4226051 RSS 1974.838 GRSq 0.01125388 RSq 0.01378426Show the code
# Variable importance
evimp(mars_model_health_condition)
nsubsets gcv rss
PTSD5_Score 3 100.0 100.0
Anxiety_Severity_num 2 54.6 60.5Cross validation on Health Condition
Show the code
library(earth)

mars_model_health_condition <- earth(
    Cancer_Avoidance_Mean ~ Stressful_Events_Recent + Current_Depression + Anxiety_Severity_num +
    PTSD5_Score +  Health_Depression_Severity_num + Stress_TotalScore,
  data = train,
  degree = 2,       # allow up to 2-way interactions
  nk = 100,
  nfold = 10,       # 10-fold CV
  keepxy = TRUE
)
summary(mars_model_health_condition)
Call: earth(formula=Cancer_Avoidance_Mean~Stressful_Events_Recent+Curr...),
data=train, keepxy=TRUE, degree=2, nfold=10, nk=100)
coefficients
(Intercept) 1.7554511
h(Anxiety_Severity_num-3) 0.1876404
h(1-PTSD5_Score) * h(Health_Depression_Severity_num-2) -0.1606336
h(1-PTSD5_Score) * h(2-Health_Depression_Severity_num) -0.1142280
Selected 4 of 7 terms, and 3 of 7 predictors
Termination condition: RSq changed by less than 0.001 at 7 terms
Importance: Anxiety_Severity_num, PTSD5_Score, ...
Number of terms at each degree of interaction: 1 1 2
GCV 0.4222774 RSS 1972.042 GRSq 0.01202064 RSq 0.01518066 CVRSq 0.007416397
Note: the cross-validation sd's below are standard deviations across folds
Cross validation: nterms 4.50 sd 0.85 nvars 3.30 sd 0.67
CVRSq sd MaxErr sd
0.007 0.013 2.38 0.126Show the code
pred <- predict(mars_model_health_condition, newdata = test)
rmse <- sqrt(mean((pred - test$Cancer_Avoidance_Mean)^2))
cor(pred, test$Cancer_Avoidance_Mean)
[,1]
Cancer_Avoidance_Mean 0.1040759Logistic Regression
MacArthur Scale vs cancer-avoidance score
Show the code
MacArthur_cancer_logistic <- glm(Cancer_Avoiders01 ~ MacArthur_Numeric, data = demo_data, family = binomial)
summary(MacArthur_cancer_logistic)
Call:
glm(formula = Cancer_Avoiders01 ~ MacArthur_Numeric, family = binomial,
    data = demo_data)

Coefficients:
                  Estimate Std. Error z value Pr(>|z|)
(Intercept)       -2.60672    0.16138 -16.153  < 2e-16 ***
MacArthur_Numeric -0.10770    0.03161  -3.407 0.000656 ***
---
Signif. codes:  0 '***' 0.001 '**' 0.01 '*' 0.05 '.' 0.1 ' ' 1

(Dispersion parameter for binomial family taken to be 1)

    Null deviance: 2795.9  on 8092  degrees of freedom
Residual deviance: 2784.3  on 8091  degrees of freedom
AIC: 2788.3

Number of Fisher Scoring iterations: 6
AI usage vs cancer-avoidance score
Show the code
AI_Use_logistic <- glm(Cancer_Avoiders01 ~ AI_Use, data = media_data, family = binomial)
summary(AI_Use_logistic)
Call:
glm(formula = Cancer_Avoiders01 ~ AI_Use, family = binomial,
    data = media_data)

Coefficients:
            Estimate Std. Error z value Pr(>|z|)
(Intercept) -2.93337    0.06111 -48.001   <2e-16 ***
AI_UseNo    -0.25546    0.15668  -1.631    0.103
---
Signif. codes:  0 '***' 0.001 '**' 0.01 '*' 0.05 '.' 0.1 ' ' 1

(Dispersion parameter for binomial family taken to be 1)

    Null deviance: 2656.9  on 6843  degrees of freedom
Residual deviance: 2654.1  on 6842  degrees of freedom
AIC: 2658.1

Number of Fisher Scoring iterations: 5
Stress score vs cancer-avoidance score
Show the code
stress_cancer_logistic <- glm(Cancer_Avoiders01 ~ Stress_TotalScore, data = health_condition_data, family = binomial)
summary(stress_cancer_logistic)
Call:
glm(formula = Cancer_Avoiders01 ~ Stress_TotalScore, family = binomial,
    data = health_condition_data)

Coefficients:
                  Estimate Std. Error z value Pr(>|z|)
(Intercept)       -3.02093    0.09918 -30.460   <2e-16 ***
Stress_TotalScore  0.01689    0.01924   0.878     0.38
---
Signif. codes:  0 '***' 0.001 '**' 0.01 '*' 0.05 '.' 0.1 ' ' 1

(Dispersion parameter for binomial family taken to be 1)

    Null deviance: 2648.0  on 6696  degrees of freedom
Residual deviance: 2647.3  on 6695  degrees of freedom
AIC: 2651.3

Number of Fisher Scoring iterations: 5
Smoking vs cancer-avoidance score
Show the code
smoking_cancer_logistic <- glm(Cancer_Avoiders01 ~ Cigarette_Smoking_num, data = health_behavior_data, family = binomial)
summary(smoking_cancer_logistic)
Call:
glm(formula = Cancer_Avoiders01 ~ Cigarette_Smoking_num, family = binomial,
    data = health_behavior_data)

Coefficients:
                       Estimate Std. Error z value Pr(>|z|)
(Intercept)             -3.0998     0.0644 -48.136  < 2e-16 ***
Cigarette_Smoking_num1   0.6244     0.1283   4.866 1.14e-06 ***
---
Signif. codes:  0 '***' 0.001 '**' 0.01 '*' 0.05 '.' 0.1 ' ' 1

(Dispersion parameter for binomial family taken to be 1)

    Null deviance: 2717.9  on 6978  degrees of freedom
Residual deviance: 2696.4  on 6977  degrees of freedom
AIC: 2700.4

Number of Fisher Scoring iterations: 6
Climate Change vs cancer-avoidance score
Show the code
climate_cancer_logistic <- glm(Cancer_Avoiders01 ~ Climate_Change_Belief, data = other_data, family = binomial)
summary(climate_cancer_logistic)
Call:
glm(formula = Cancer_Avoiders01 ~ Climate_Change_Belief, family = binomial,
    data = other_data)

Coefficients:
                                                                                                                                                           Estimate
(Intercept)                                                                                                                                                 -2.0239
Climate_Change_BeliefSomewhat skeptical about the impact of human activities on climate change, believing that climate change is a natural cycle.           -0.4822
Climate_Change_BeliefUncertain about the causes and extent of climate change.                                                                               -0.6868
Climate_Change_BeliefNo opinion on the matter.                                                                                                              -0.1903
Climate_Change_BeliefSomewhat believe climate change is occurring and is influenced by human activities, but natural factors also play a significant role.  -1.0713
Climate_Change_BeliefStrongly believe climate change is occurring and is primarily caused by human activities.                                              -1.2332
                                                                                                                                                           Std. Error
(Intercept)                                                                                                                                                    0.1749
Climate_Change_BeliefSomewhat skeptical about the impact of human activities on climate change, believing that climate change is a natural cycle.              0.2480
Climate_Change_BeliefUncertain about the causes and extent of climate change.                                                                                  0.2707
Climate_Change_BeliefNo opinion on the matter.                                                                                                                 0.3405
Climate_Change_BeliefSomewhat believe climate change is occurring and is influenced by human activities, but natural factors also play a significant role.     0.2064
Climate_Change_BeliefStrongly believe climate change is occurring and is primarily caused by human activities.                                                 0.1938
                                                                                                                                                           z value
(Intercept)                                                                                                                                                -11.570
Climate_Change_BeliefSomewhat skeptical about the impact of human activities on climate change, believing that climate change is a natural cycle.           -1.945
Climate_Change_BeliefUncertain about the causes and extent of climate change.                                                                               -2.538
Climate_Change_BeliefNo opinion on the matter.                                                                                                              -0.559
Climate_Change_BeliefSomewhat believe climate change is occurring and is influenced by human activities, but natural factors also play a significant role.  -5.190
Climate_Change_BeliefStrongly believe climate change is occurring and is primarily caused by human activities.                                              -6.362
                                                                                                                                                           Pr(>|z|)
(Intercept)                                                                                                                                                 < 2e-16
Climate_Change_BeliefSomewhat skeptical about the impact of human activities on climate change, believing that climate change is a natural cycle.            0.0518
Climate_Change_BeliefUncertain about the causes and extent of climate change.                                                                                0.0112
Climate_Change_BeliefNo opinion on the matter.                                                                                                               0.5762
Climate_Change_BeliefSomewhat believe climate change is occurring and is influenced by human activities, but natural factors also play a significant role. 2.10e-07
Climate_Change_BeliefStrongly believe climate change is occurring and is primarily caused by human activities.                                             1.99e-10

(Intercept)                                                                                                                                                ***
Climate_Change_BeliefSomewhat skeptical about the impact of human activities on climate change, believing that climate change is a natural cycle.          .
Climate_Change_BeliefUncertain about the causes and extent of climate change.                                                                              *
Climate_Change_BeliefNo opinion on the matter.
Climate_Change_BeliefSomewhat believe climate change is occurring and is influenced by human activities, but natural factors also play a significant role. ***
Climate_Change_BeliefStrongly believe climate change is occurring and is primarily caused by human activities.                                             ***
---
Signif. codes:  0 '***' 0.001 '**' 0.01 '*' 0.05 '.' 0.1 ' ' 1

(Dispersion parameter for binomial family taken to be 1)

    Null deviance: 2789.4  on 7341  degrees of freedom
Residual deviance: 2739.5  on 7336  degrees of freedom
AIC: 2751.5

Number of Fisher Scoring iterations: 6
References
Chae, J., Lee, C.-J., & Kim, K. (2019). Prevalence, Predictors, and Psychosocial Mechanism of Cancer Information Avoidance: Findings from a National Survey of U.S. Adults. Health Communication, 35(3), 322–330. https://doi.org/10.1080/10410236.2018.1563028
Dattilo, T. M., Roberts, C. M., Traino, K. A., Bakula, D. M., Fisher, R., Basile, N. L., Chaney, J. M., & Mullins, L. L. (2022). Illness stigma, health anxiety, illness intrusiveness, and depressive symptoms in adolescents and young adults: A path model. Stigma and Health, 7(3), 311–317. https://doi.org/10.1037/sah0000390
Emanuel, A. S., Kiviniemi, M. T., Howell, J. L., Hay, J. L., Waters, E. A., Orom, H., & Shepperd, J. A. (2015). Avoiding cancer risk information. Social Science & Medicine, 147, 113–120. https://doi.org/10.1016/j.socscimed.2015.10.058
Gigerenzer, G., & Garcia-Retamero, R. (2017). Cassandra’s regret: The psychology of not wanting to know. Psychological Review, 124(2), 179–196. https://doi.org/10.1037/rev0000055
Ho, E. H., Hagmann, D., & Loewenstein, G. (2021). Measuring Information Preferences. Management Science, 67(1), 126–145. https://doi.org/10.1287/mnsc.2019.3543
Howell, J. L., Lipsey, N. P., & Shepperd, J. A. (2020). Health Information Avoidance. The Wiley Encyclopedia of Health Psychology, 279–286. https://doi.org/10.1002/9781119057840.ch77
Kelly, Christopher. A., & Sharot, T. (2021). Individual differences in information-seeking. Nature Communications, 12(1). https://doi.org/10.1038/s41467-021-27046-5
O’Brien, A. G., Meese, W. B., Taber, J. M., Johnson, A. E., Hinojosa, B. M., Burton, R., Ranjan, S., Rodarte, E. D., Coward, C., & Howell, J. L. (2024). Why do people avoid health risk information? A qualitative analysis. SSM - Qualitative Research in Health, 6, 100461. https://doi.org/10.1016/j.ssmqr.2024.100461
Orom, H., Schofield, E., Kiviniemi, M. T., Waters, E. A., & Hay, J. L. (2020). Agency beliefs are associated with lower health information avoidance. Health Education Journal, 80(3), 272–286. https://doi.org/10.1177/0017896920967046
Song, S., Yao, X., & Wen, N. (2021). What motivates Chinese consumers to avoid information about the COVID-19 pandemic?: The perspective of the stimulus-organism-response model. Information Processing & Management, 58(1), 102407. https://doi.org/10.1016/j.ipm.2020.102407
Soroya, S. H., & Faiola, A. (2023). Why did people avoid information during the COVID-19 pandemic? Understanding information sources’ dynamics among Pakistani Z generation. Library Hi Tech, 41(1), 229–247. https://doi.org/10.1108/lht-02-2022-0113
Sultana, T., Dhillon, G., & Oliveira, T. (2023). The effect of fear and situational motivation on online information avoidance: The case of COVID-19. International Journal of Information Management, 69, 102596. https://doi.org/10.1016/j.ijinfomgt.2022.102596
Sweeny, K., Melnyk, D., Miller, W., & Shepperd, J. A. (2010). Information Avoidance: Who, What, When, and Why. Review of General Psychology, 14(4), 340–353. https://doi.org/10.1037/a0021288
Zhao, X., & Cai, X. (2009). The Role of Risk, Efficacy, and Anxiety in Smokers’ Cancer Information Seeking. Health Communication, 24(3), 259–269. https://doi.org/10.1080/10410230902805932